> ## Documentation Index
> Fetch the complete documentation index at: https://docs.runrox.com/llms.txt
> Use this file to discover all available pages before exploring further.
# Dashboard
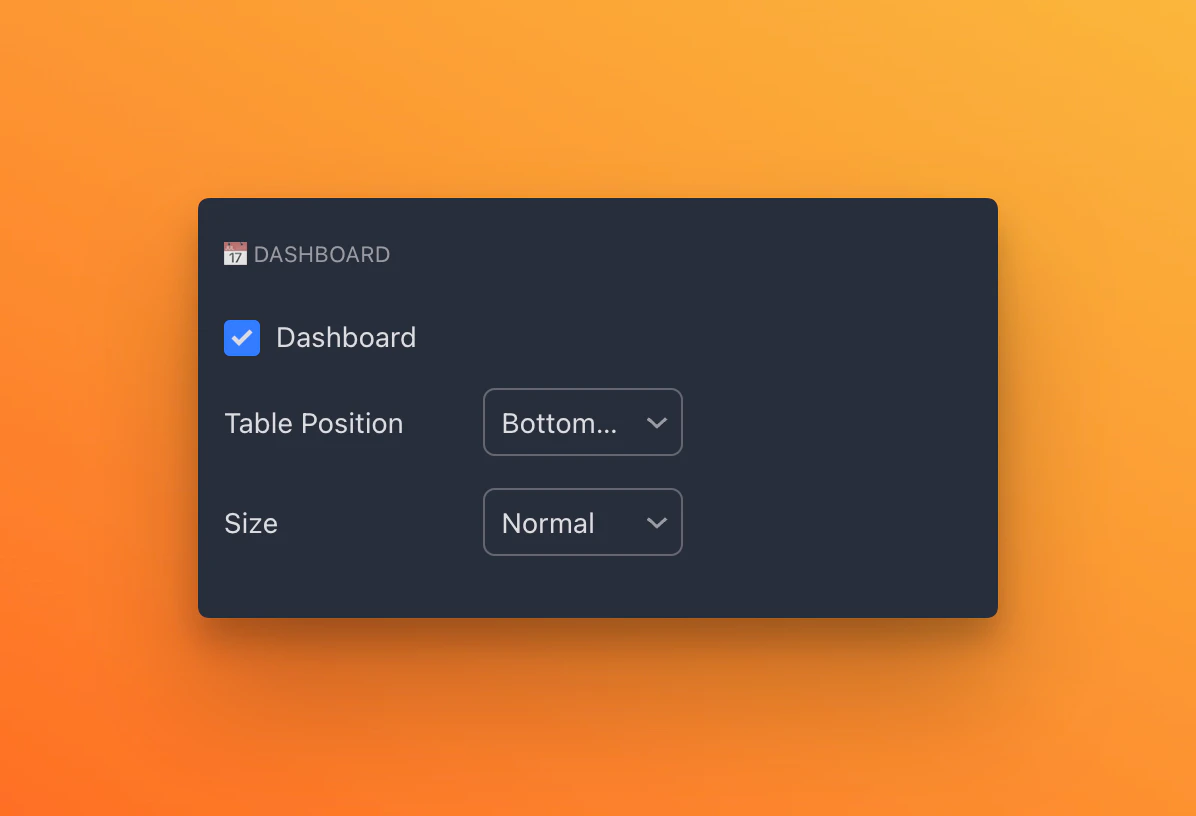 Our unique dashboard displays the optimal settings for each chart. You can place it in any convenient location and also resize it to any dimensions you desire.
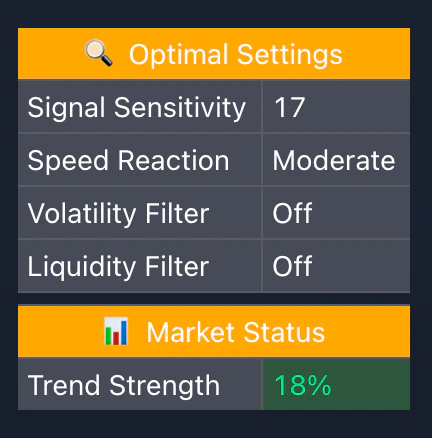 In the panel, we show the optimal settings for the current chart, as well as the strength of the trend, to determine the trend's continuation or readiness for a reversal.