IDM, or the Institutional Distribution Model, is an advanced concept within SMC that focuses on how institutional players distribute their positions in the market. By analyzing IDM, traders can better anticipate price movements and potential turning points, thereby gaining a meaningful edge in their trading.
In our structure concept, IDM can form under specific conditions. The market does not always provide a high-liquidity point to work with, so we’ve adopted a flexible approach. We generate IDM when a certain type of liquidity appears during the impulse and BOS break, allowing for a potential future liquidity sweep.
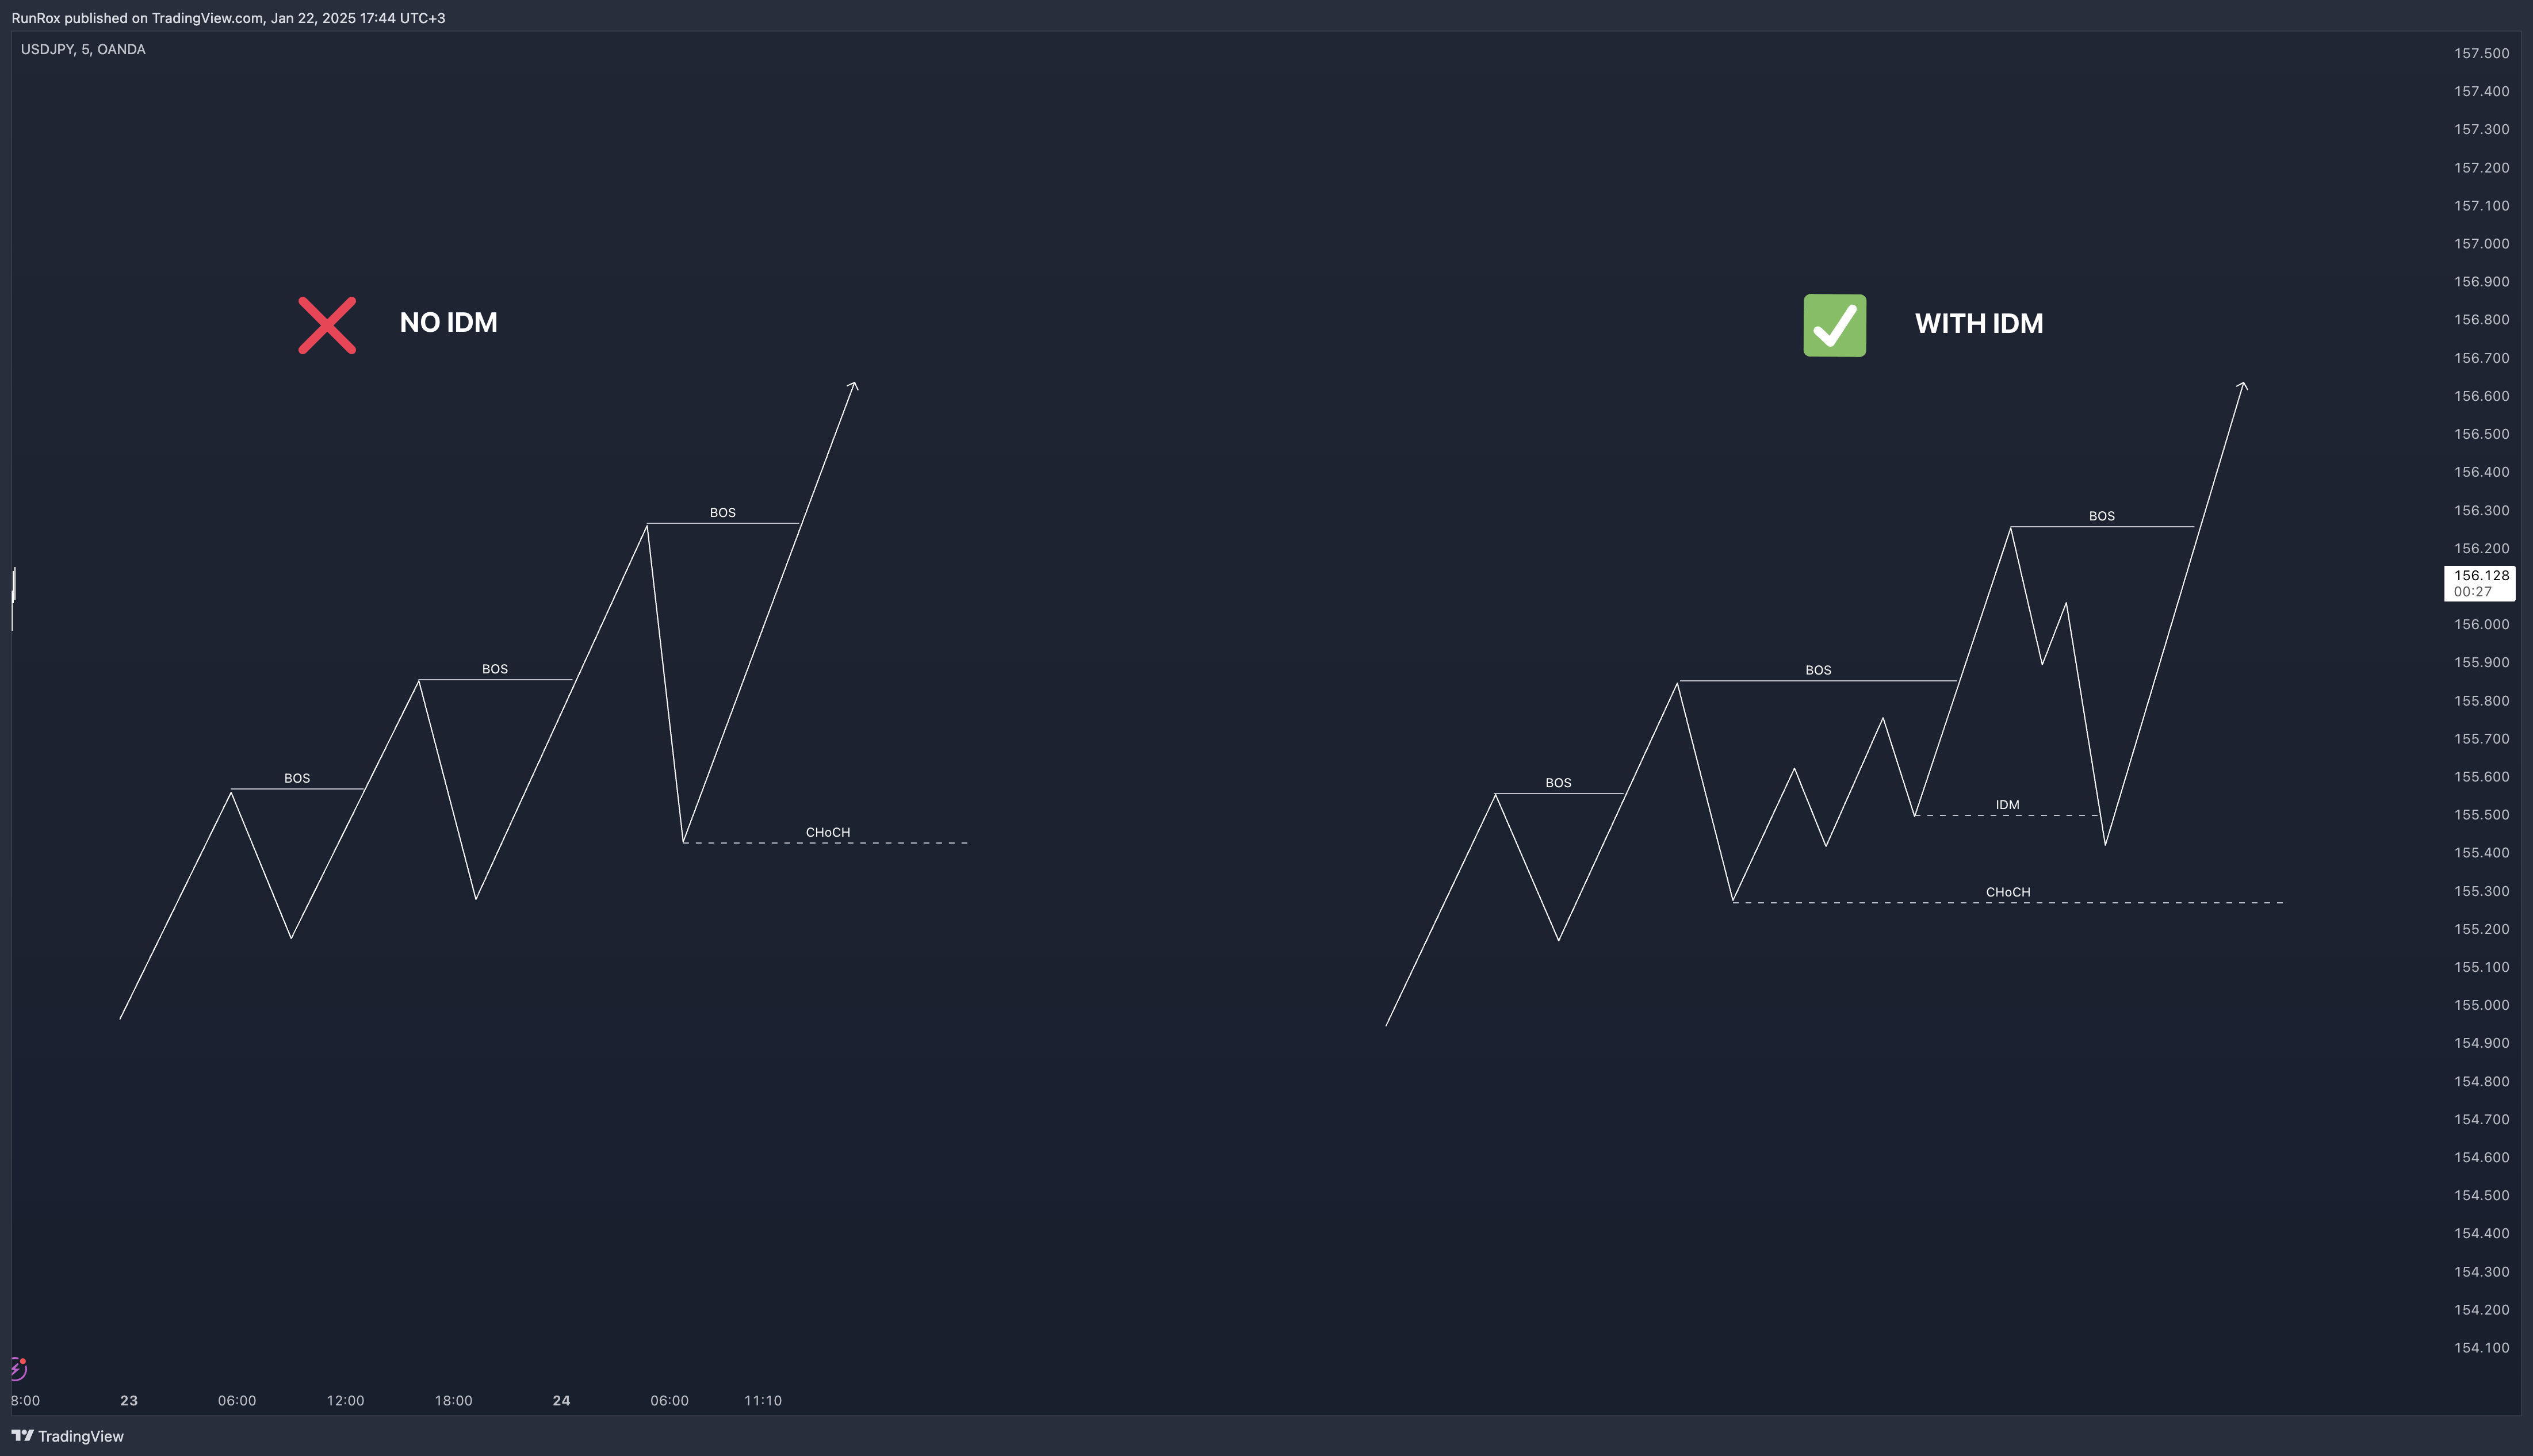
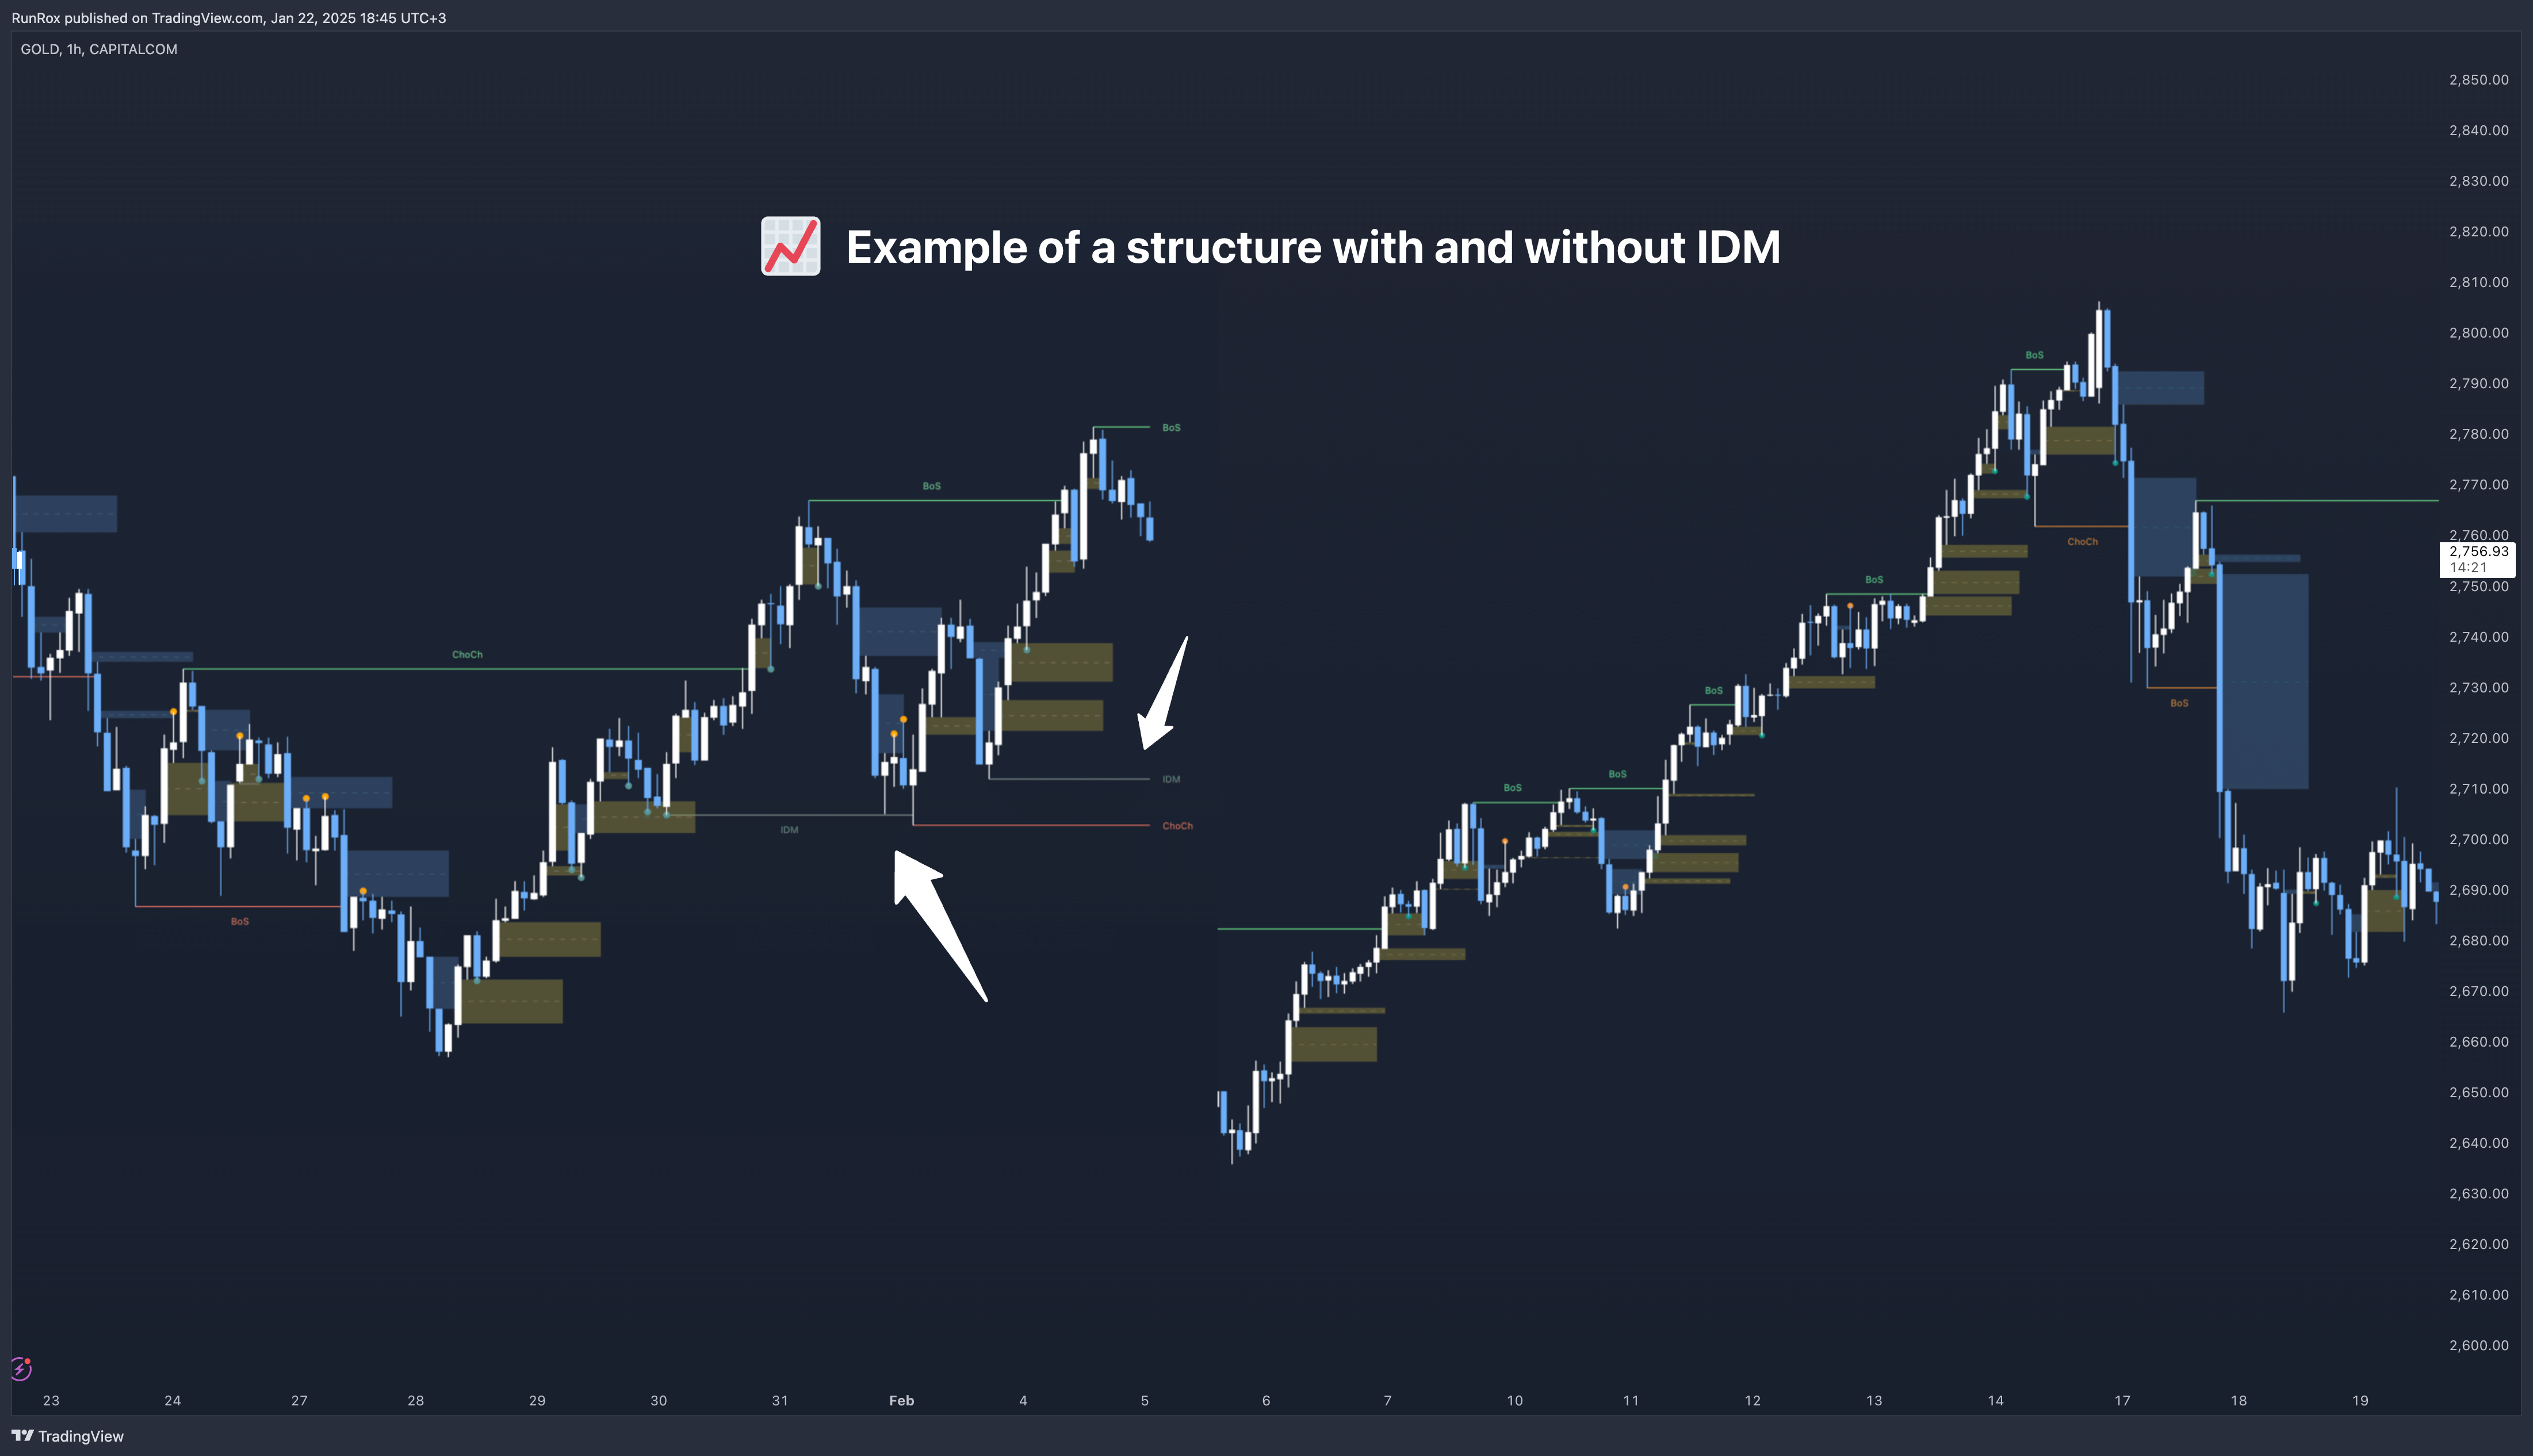
Below, I will provide an example that illustrates when IDM forms as a liquidity magnet within the structure - and when it does not.
This concept makes the structure more flexible and better able to respond immediately to market movements and key structural points.
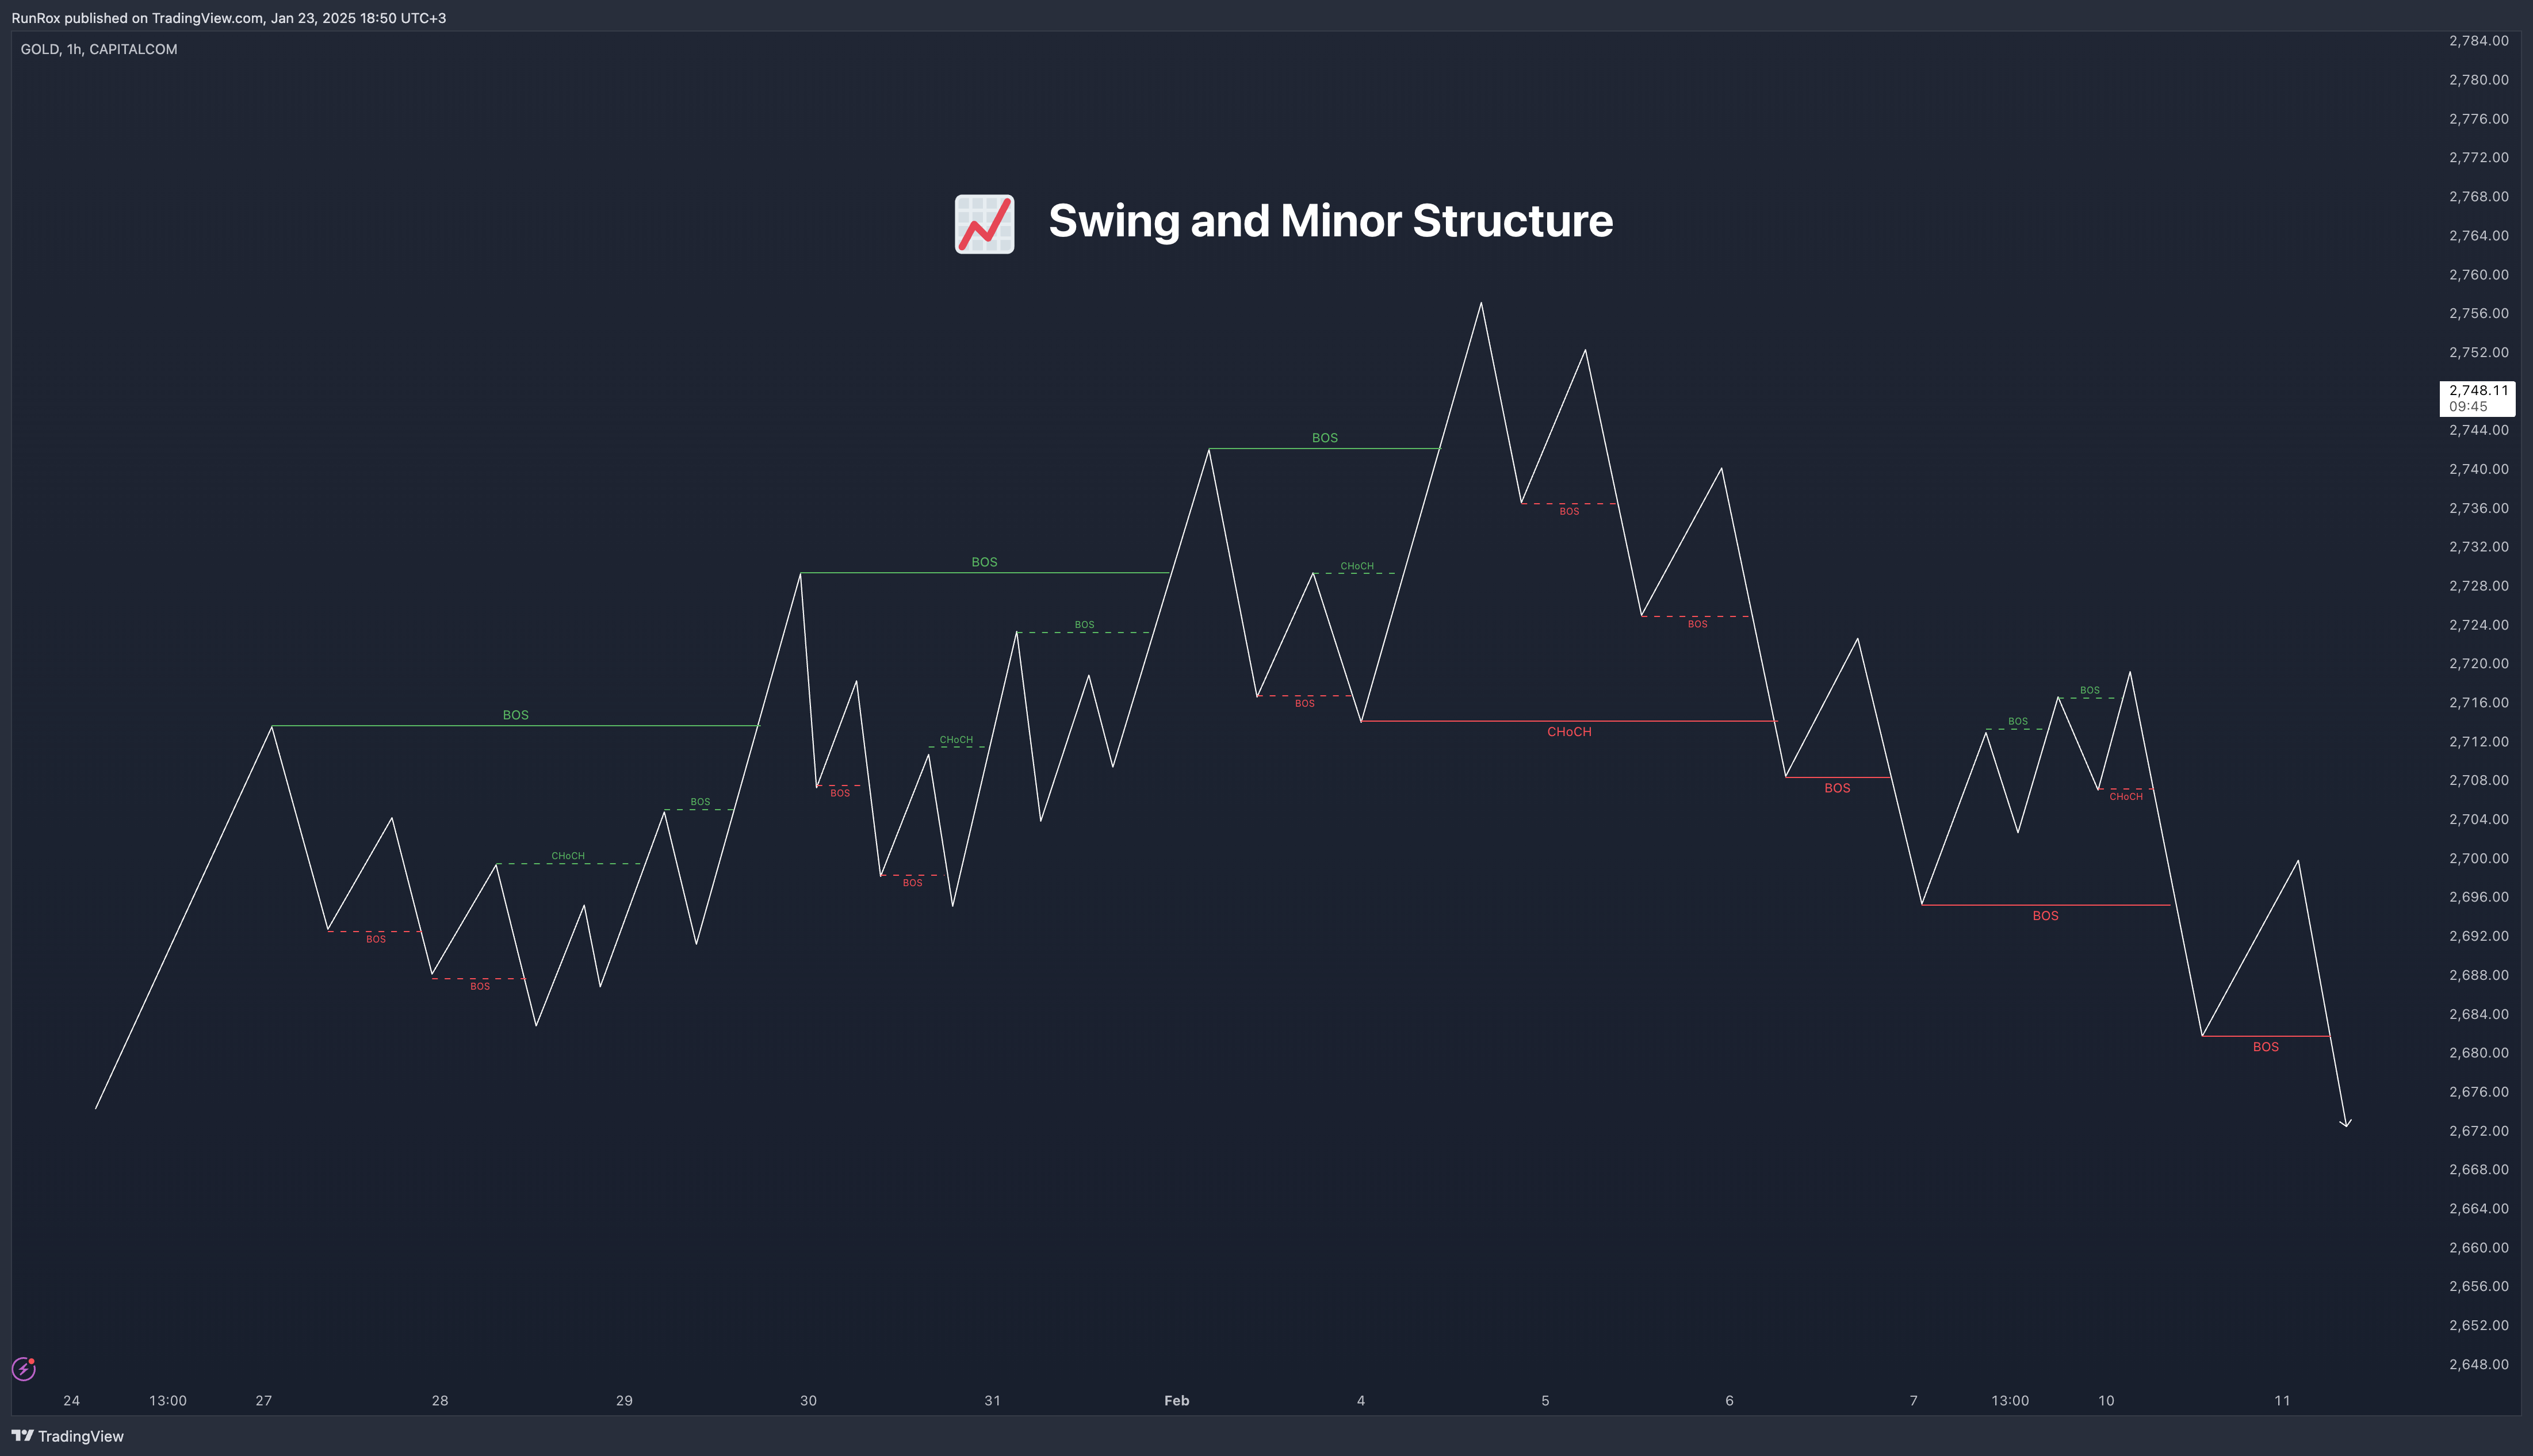
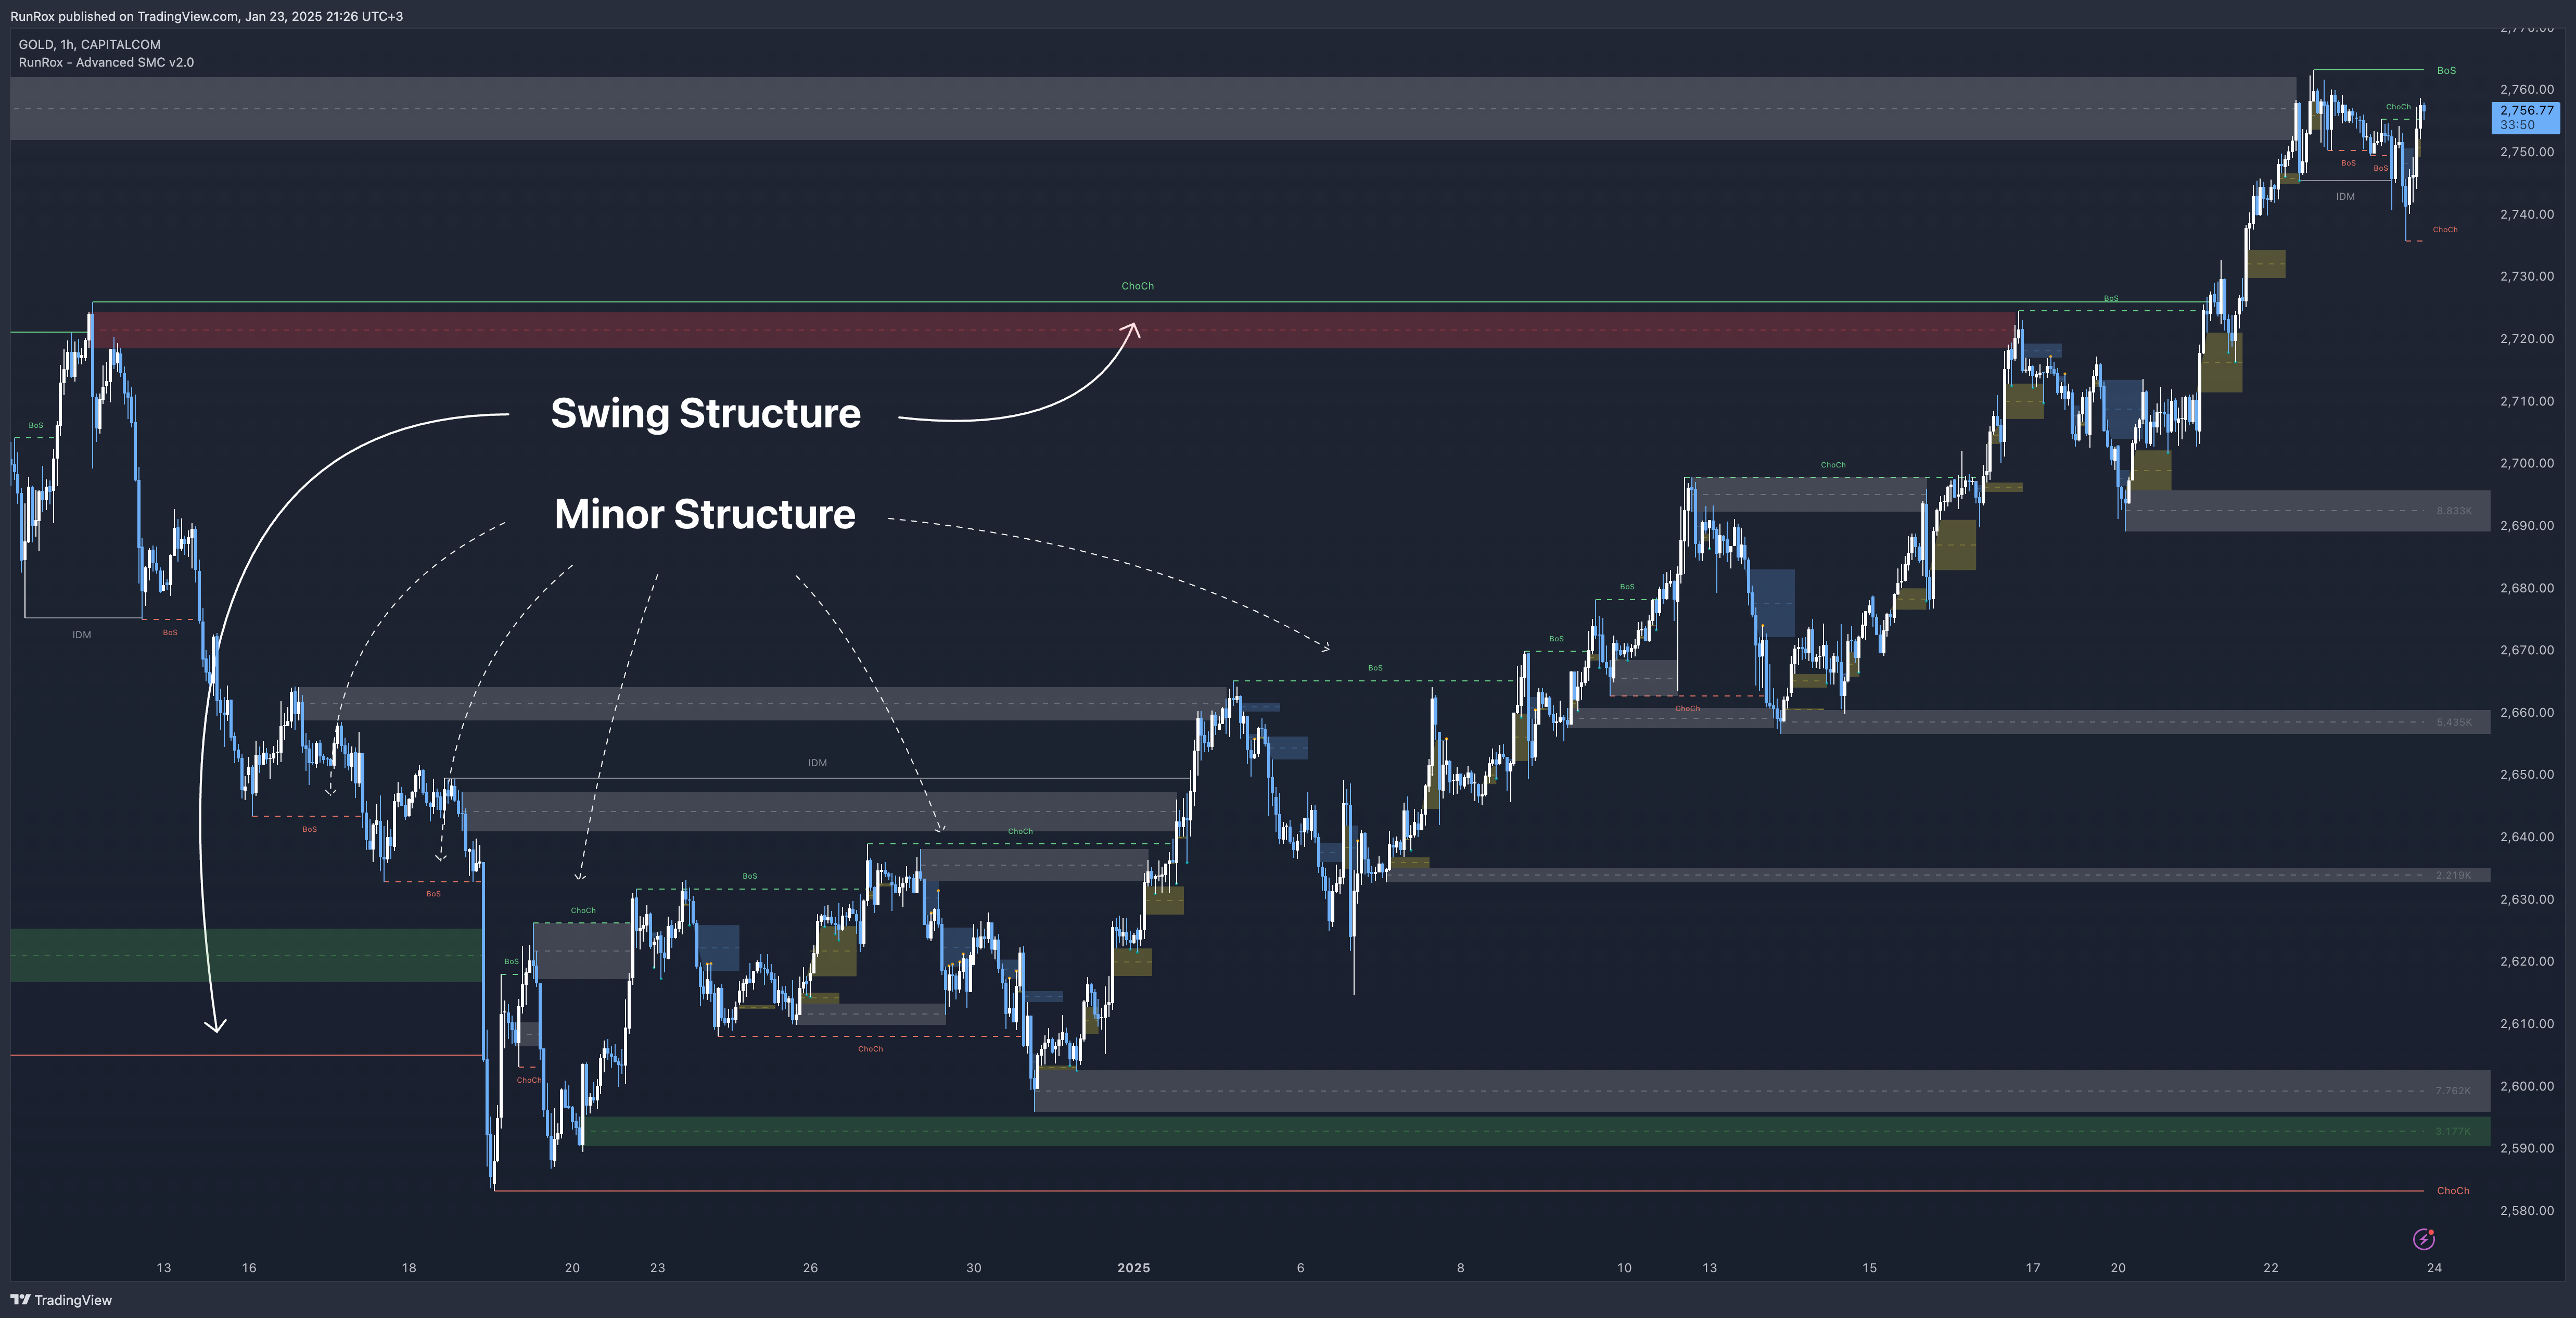
Swing structure - In this structure, as mentioned earlier, the IDM concept remains a price magnet and is formed at certain points on the chart if the conditions allow. If these points do not appear, IDM might not form at all.
Minor structure - Here, we have completely removed IDM and only kept BOS and CHoCH for structure formation. We found that for a minor structure, this approach allows faster reactions to trend changes, depending on market movements.
By making these adjustments, we have resolved the main issue of the advanced structure, which was the large distance between BOS and CHoCH that sometimes resulted in a month-long consolidation between these levels. In this version, those problems no longer occur.
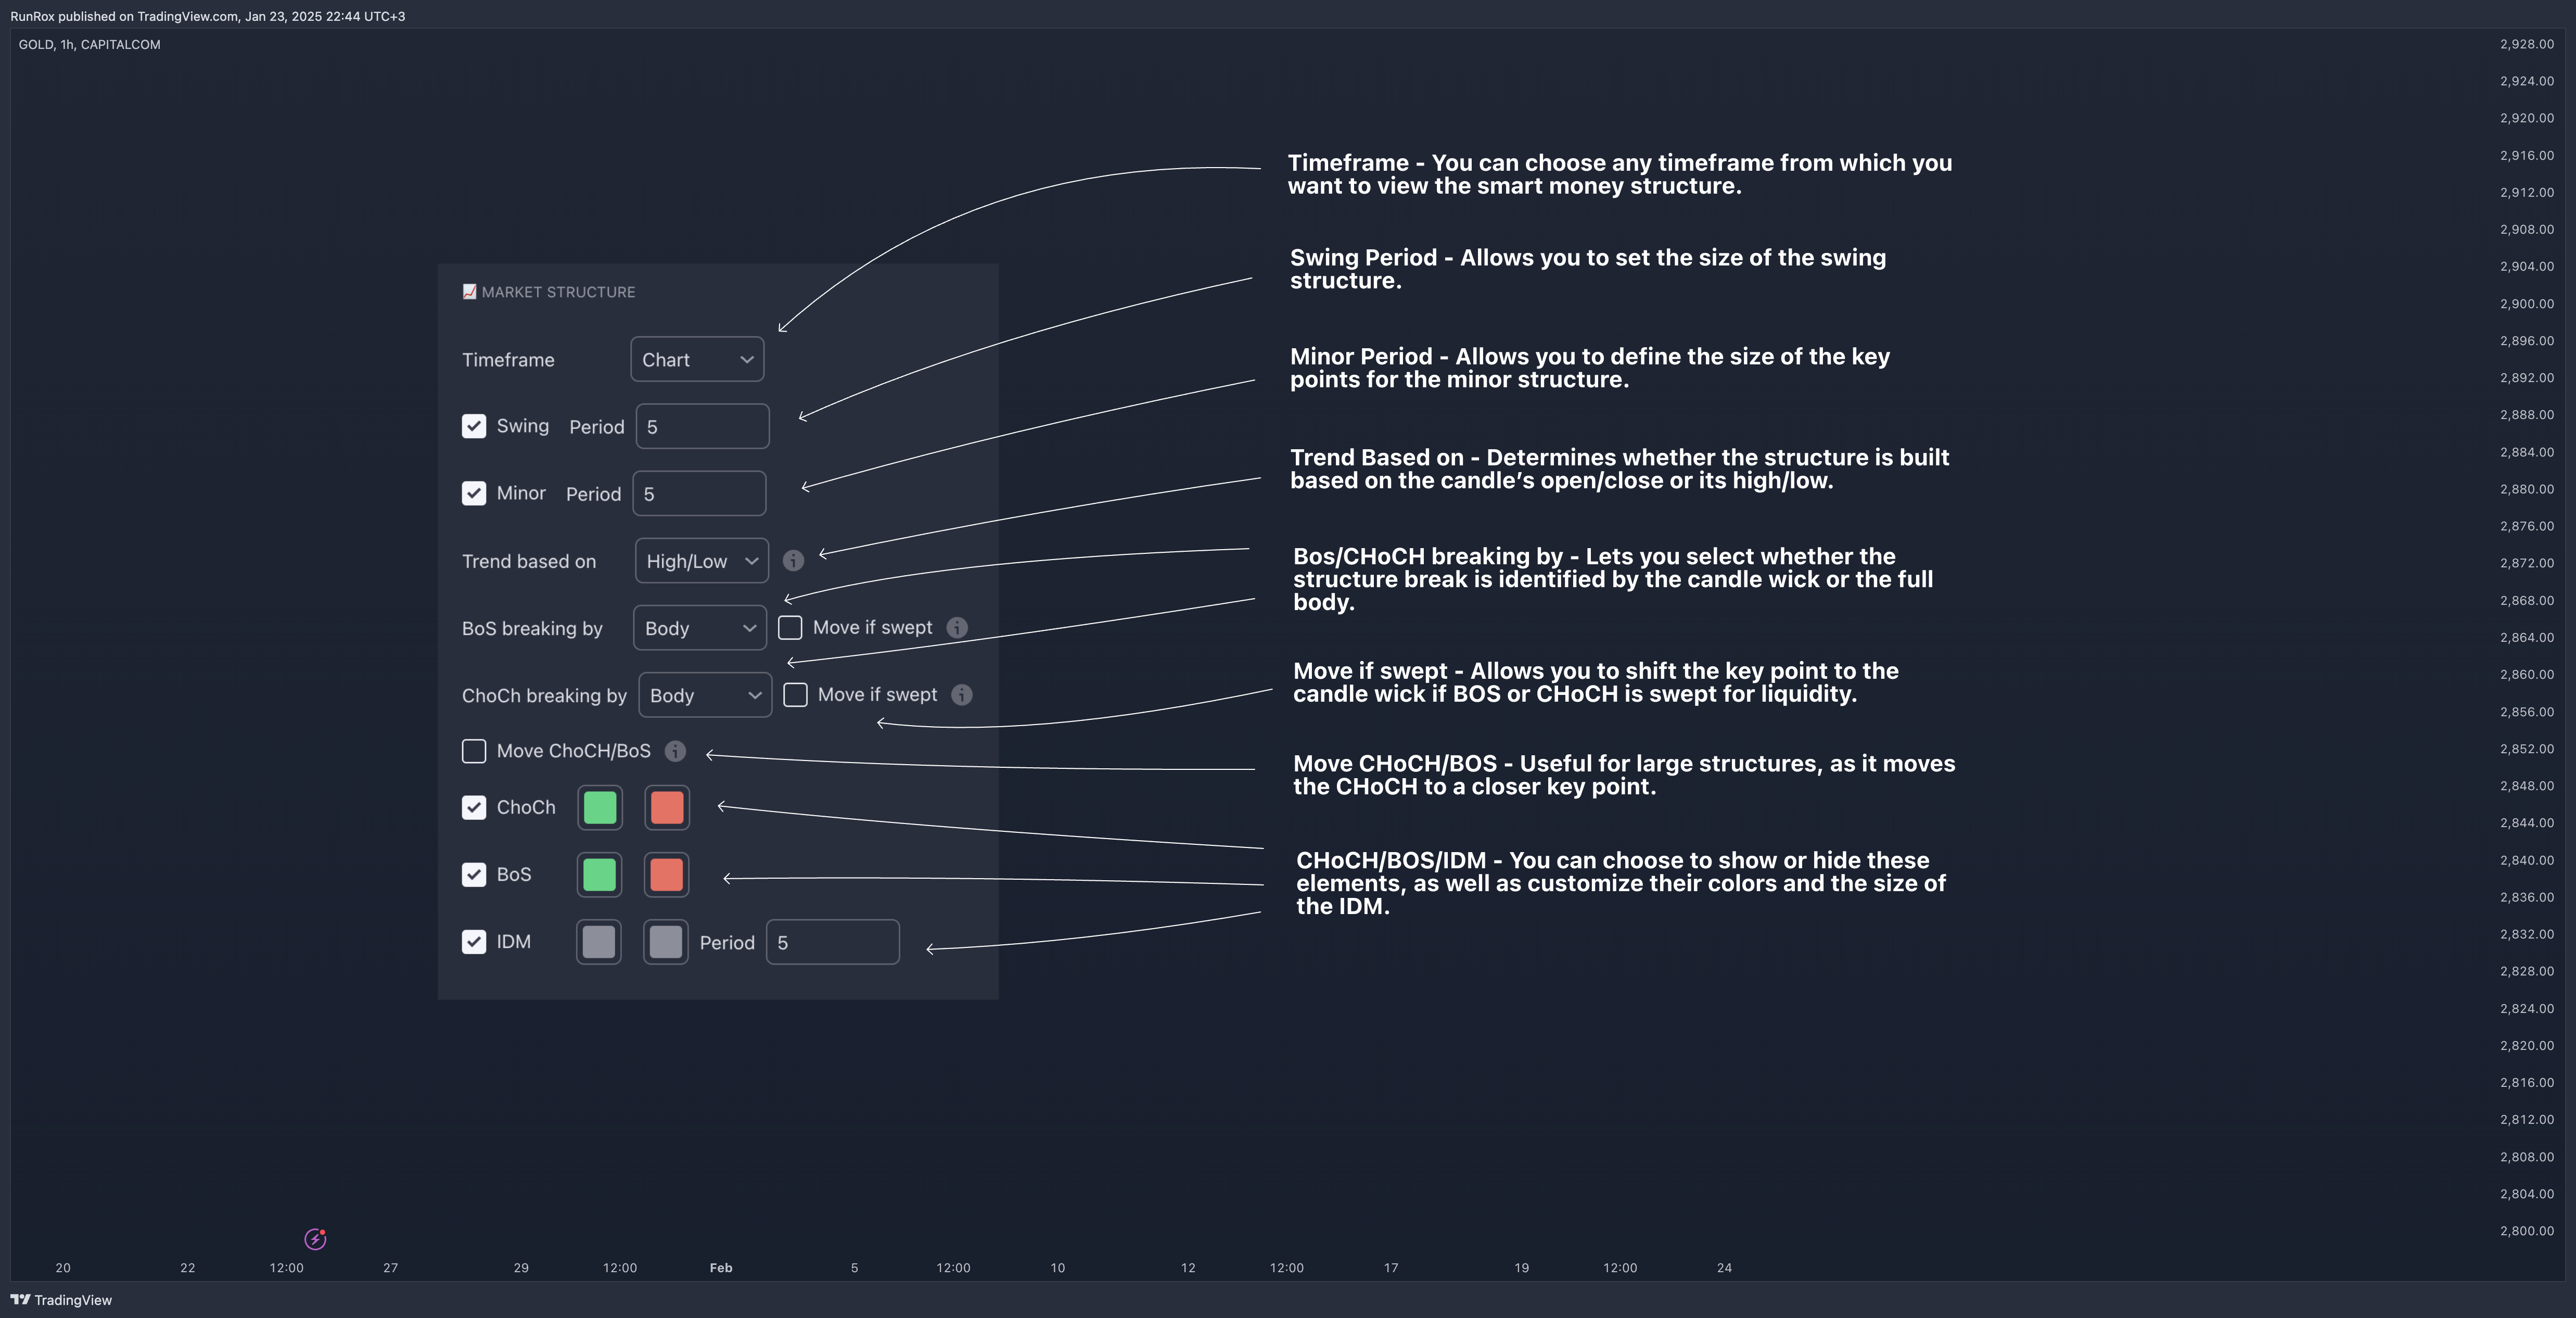
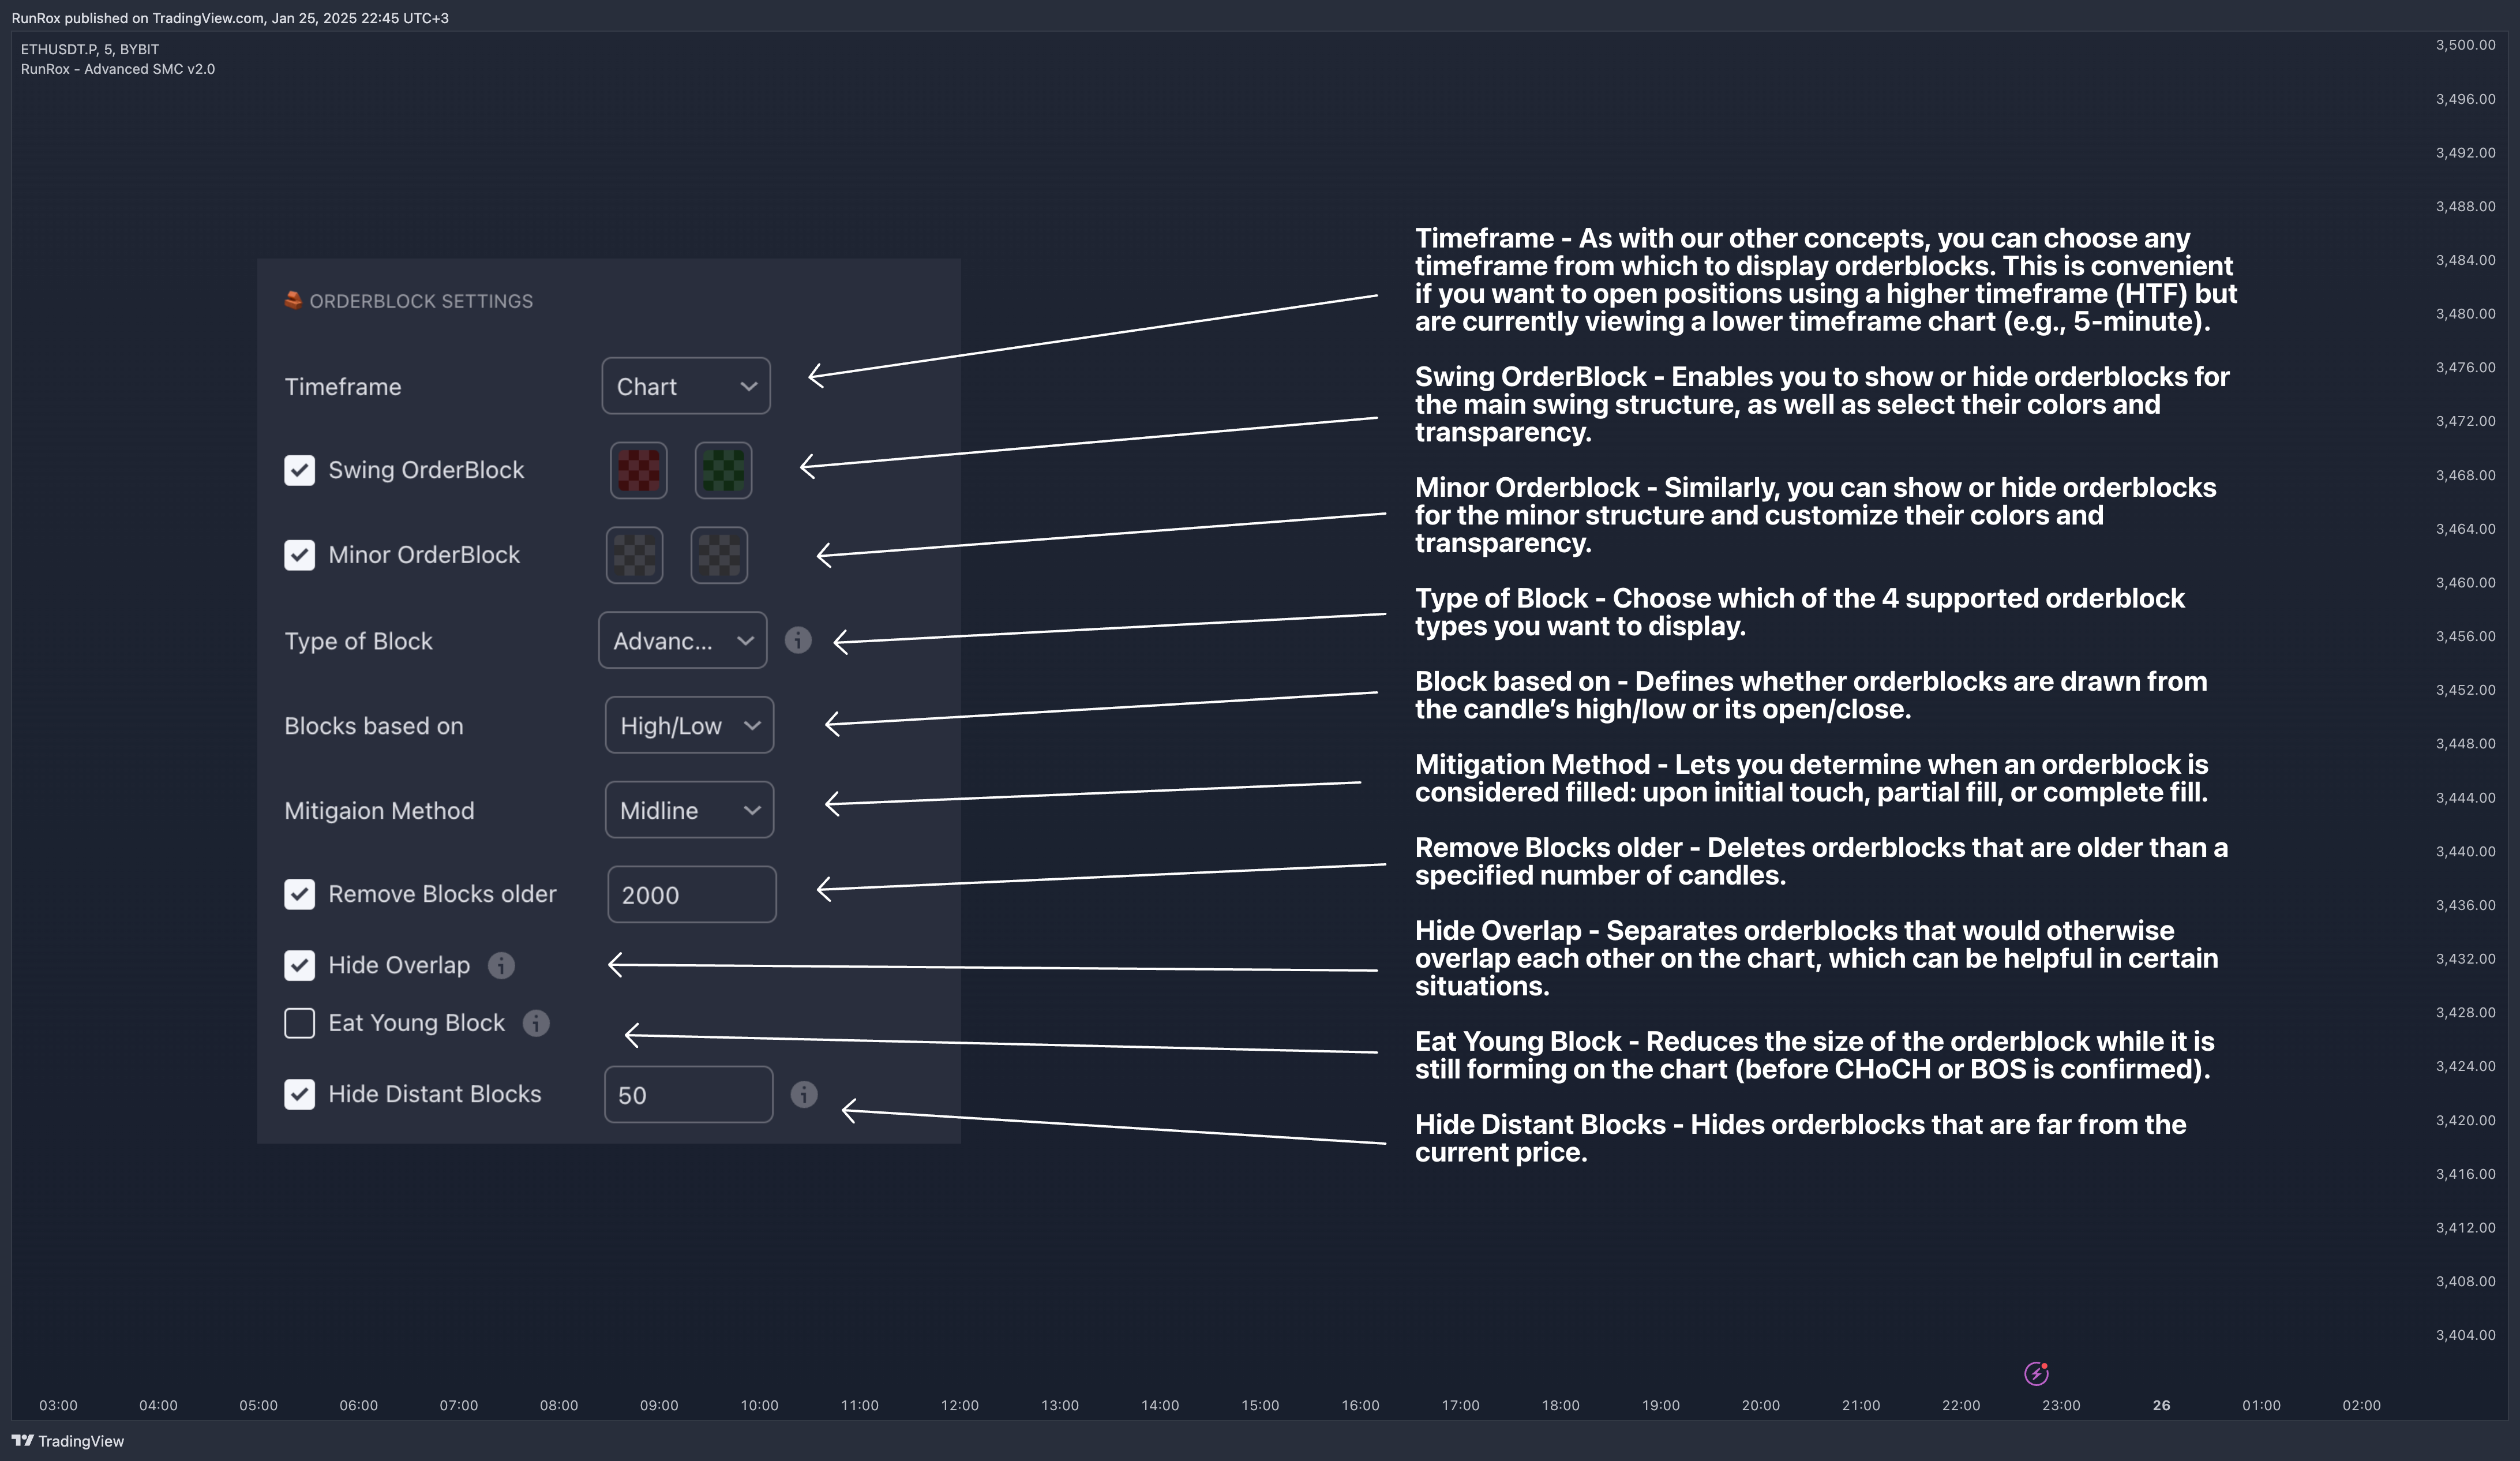
Shown above is a screenshot of the main structure settings you can adjust. These settings are highly flexible and can be tailored to fit a wide range of trading preferences.
⚖️ FVG Concept
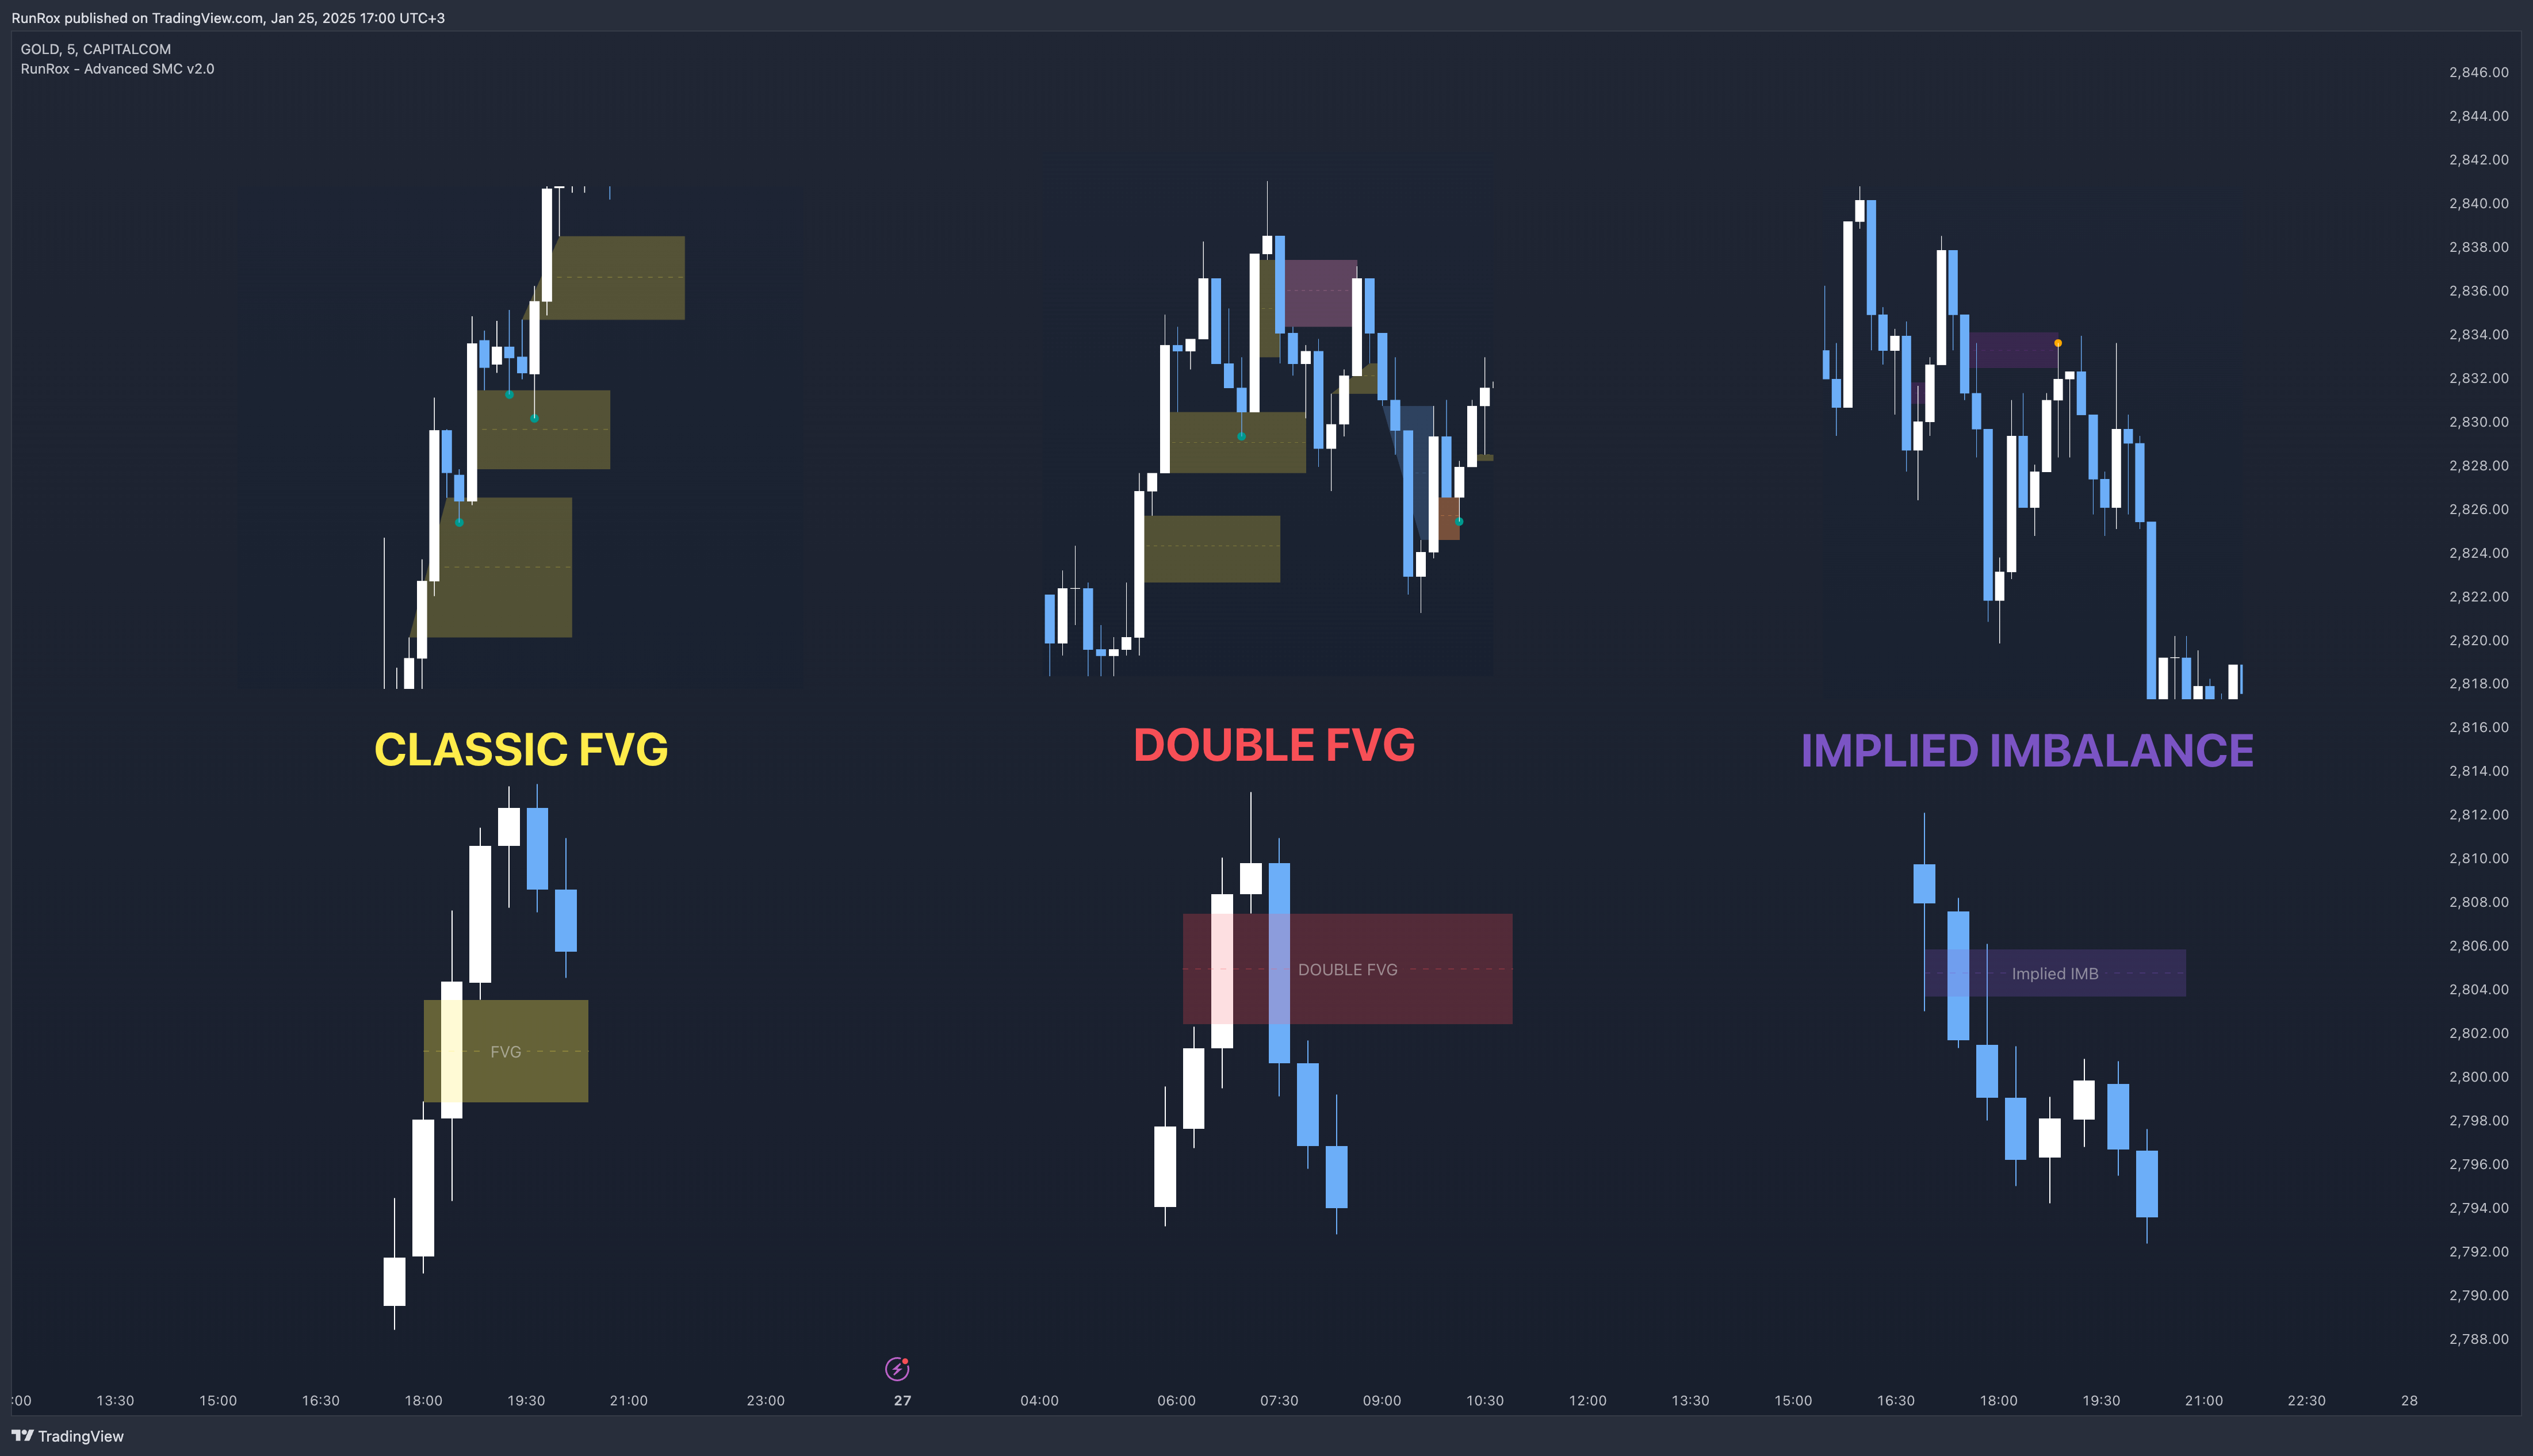
A new feature of our indicator is the FVG concept. We automatically detect three types of FVG at the moment, which will be explained below.
- FVG - the standard Fair Value Gap
- Double FVG - a double FVG, also referred to as BPR (Balanced Price Range)
- Implied Imbalance - a type of imbalance that arises from buyer or seller demand
Below, we will look at examples of the FVG types we currently identify.
We have also enhanced this concept by displaying FVG reactions on the chart. If an FVG triggers a reaction and the price responds to that range, we highlight it on the chart, so you can recognize the reaction and make timely trading decisions. A screenshot below shows how this looks in practice.
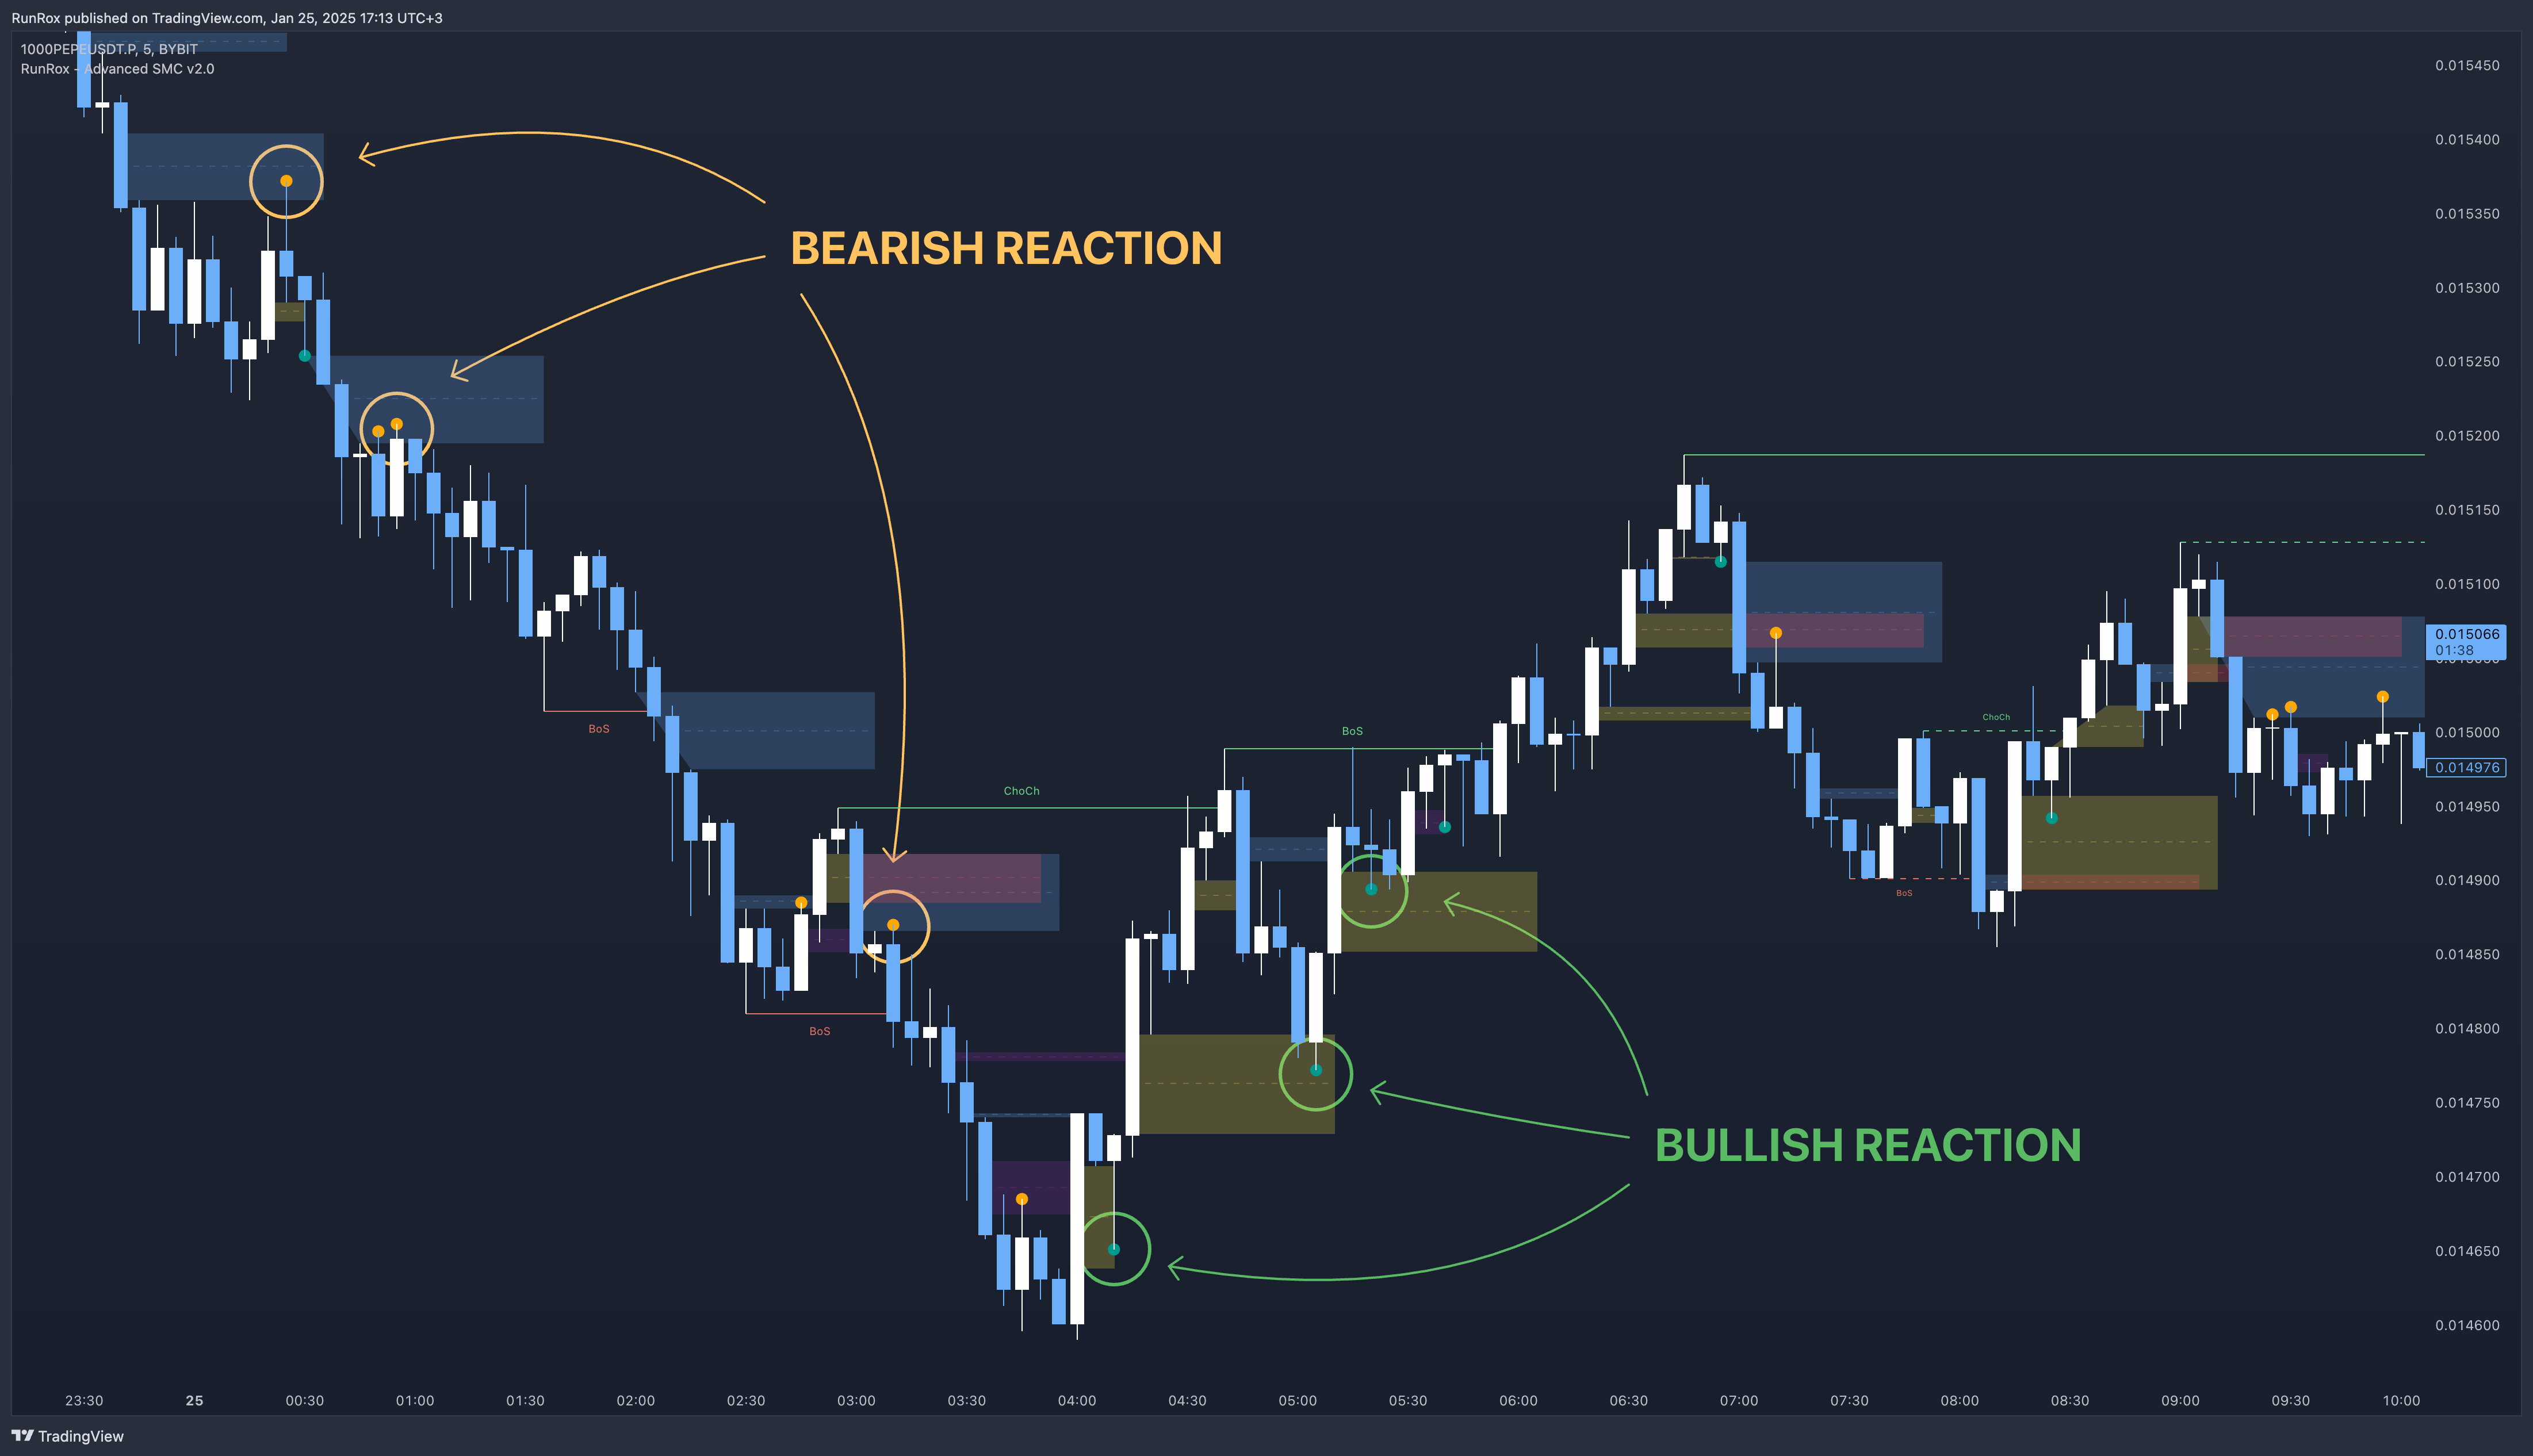
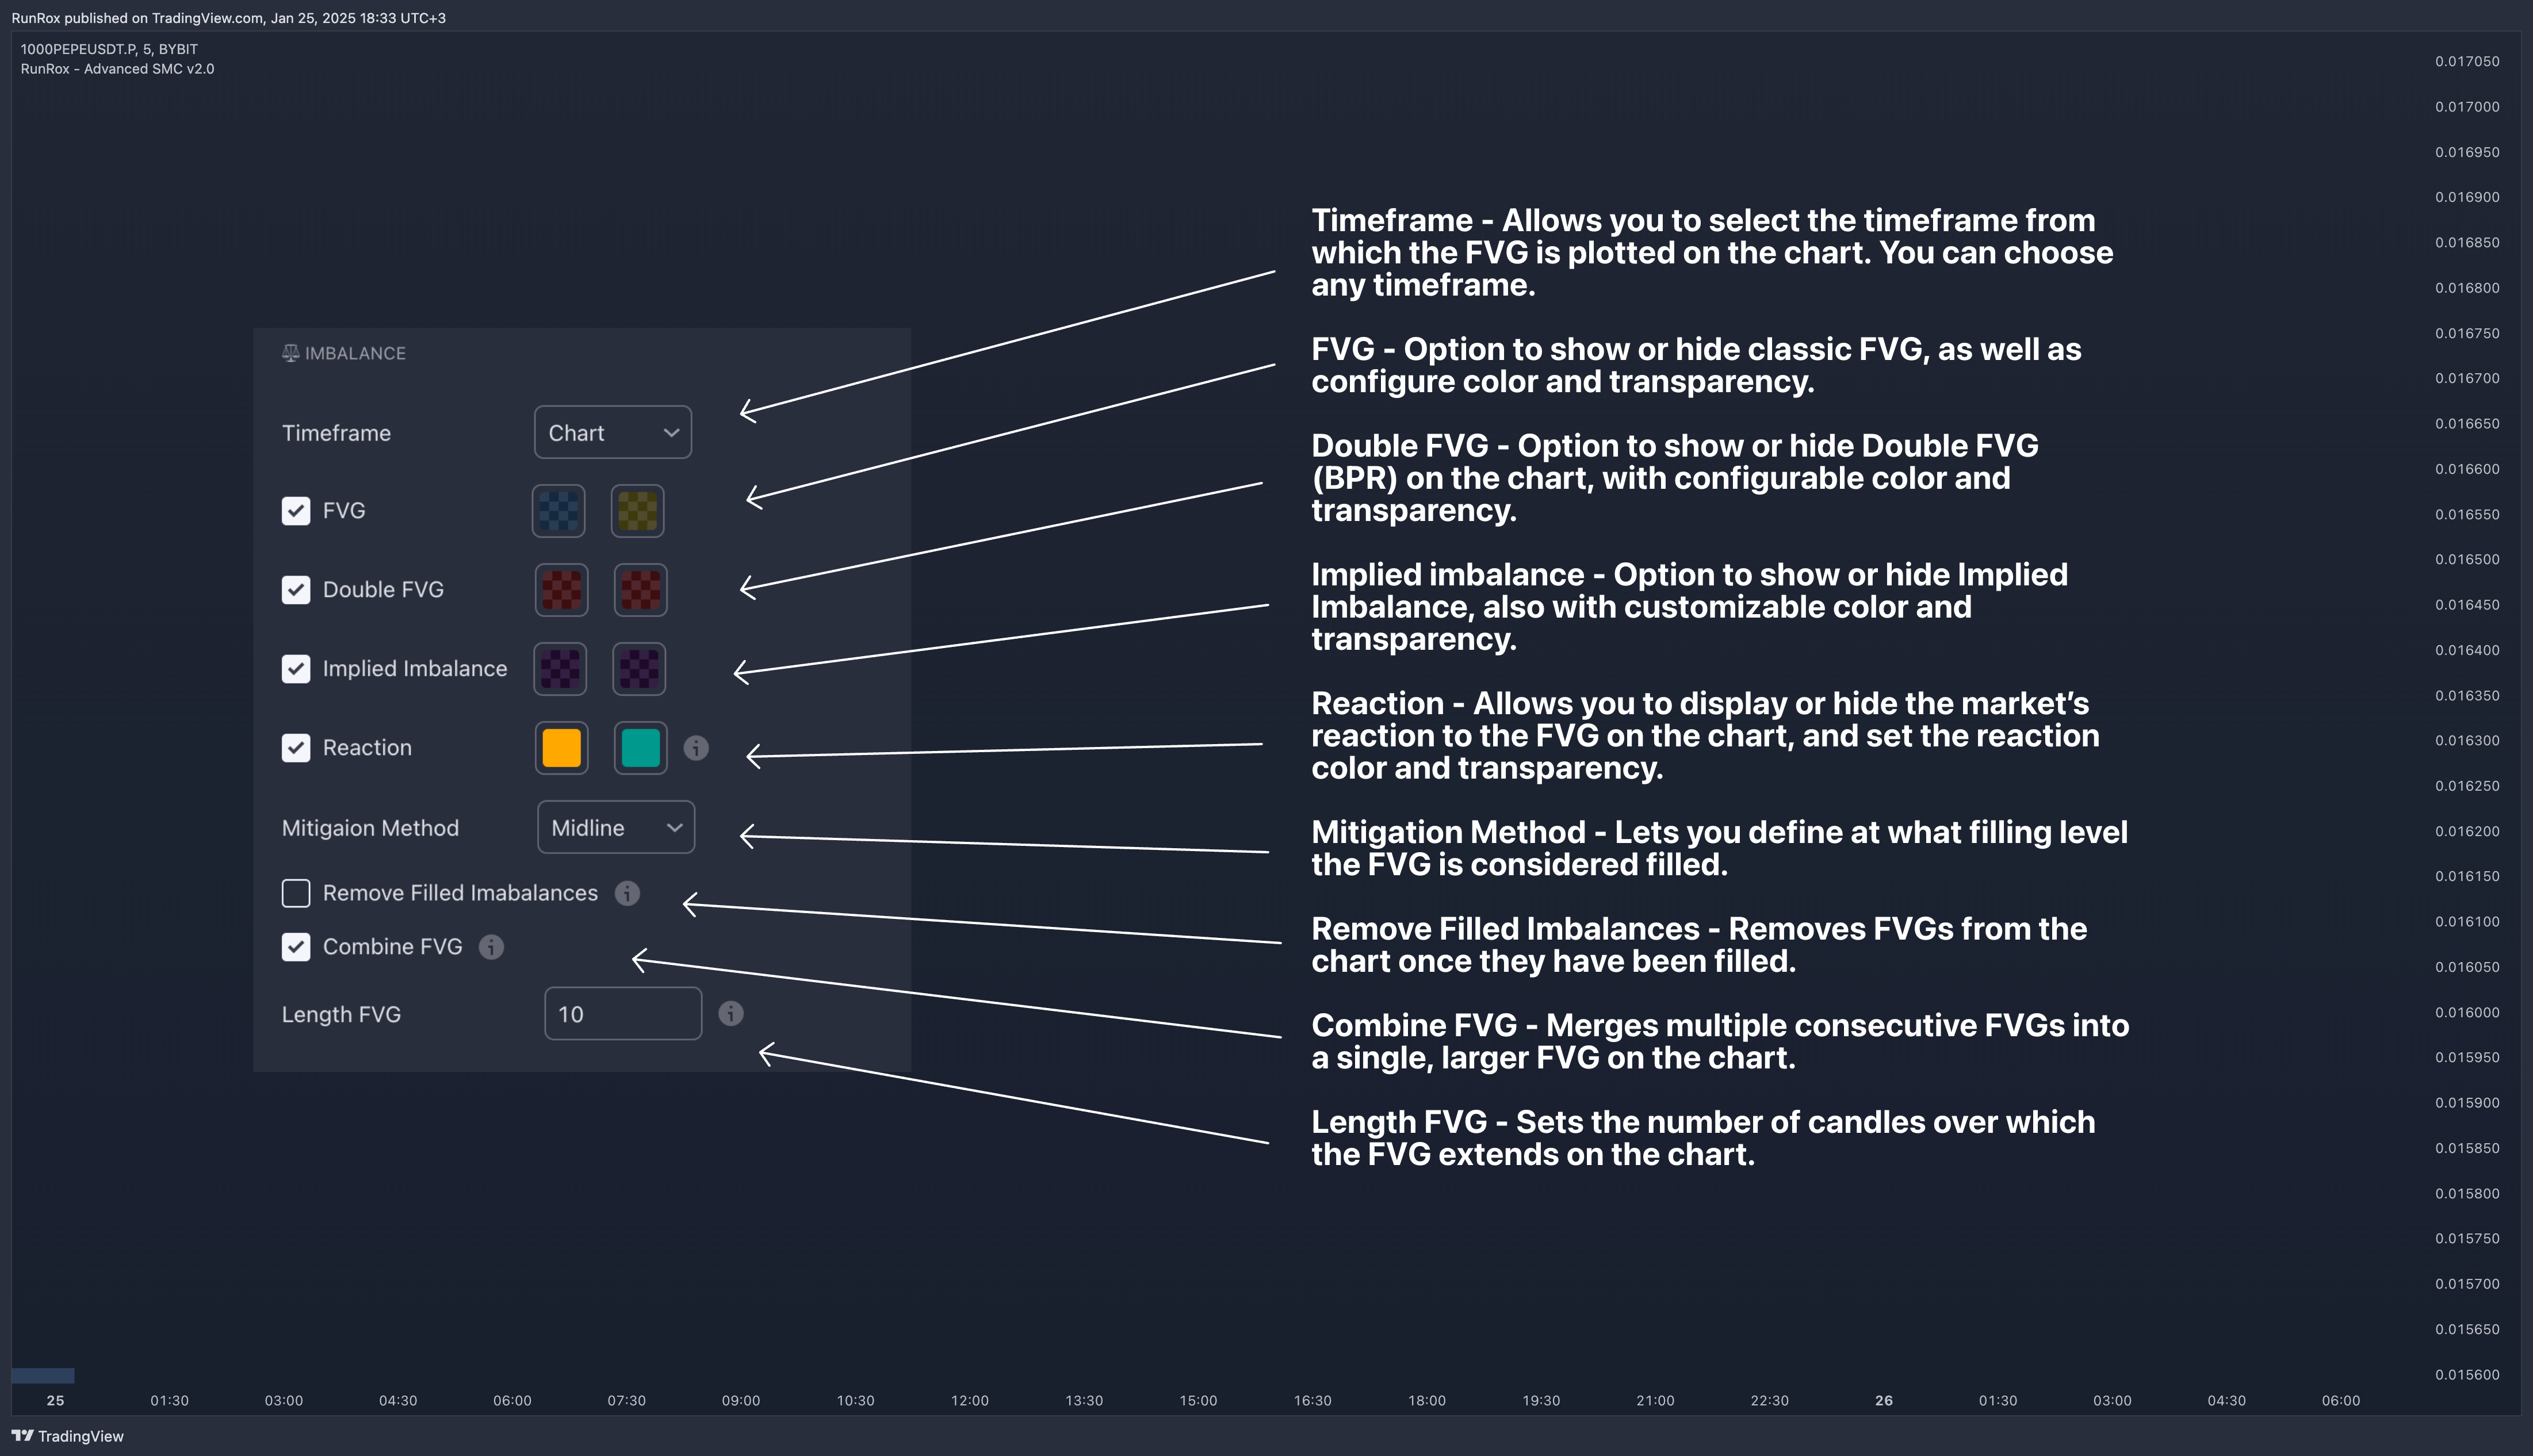
We have also enhanced this concept by displaying FVG reactions on the chart. If an FVG triggers a reaction and the price responds to that range, we highlight it on the chart, so you can recognize the reaction and make timely trading decisions. A screenshot below shows how this looks in practice. Below is a screenshot illustrating the main settings of this concept, along with detailed descriptions. OrderBlock Concept
OrderBlocks provide an effective way to identify areas of interest and make informed decisions. We have dedicated significant effort to refining this section’s functionality and have achieved strong results in doing so.
Order Block Types
- Advanced OrderBlock – A specialized type of order block generated by our internal algorithm. This can help traders aim for tighter entries and potentially more favorable risk-reward ratios within a narrow price range.
- OrderBlock – The classic type, formed at the highs or lows of a structure when a BOS or CHoCH occurs. It can still be an effective entry method but typically spans a wider price range.
- Extremum Candle – Based on liquidity grabs. The candle creating this order block must collect liquidity before making an impulsive move that breaks the BOS or CHoCH.
- BTS / STB (Buy To Sell / Sell To Buy) – This concept may appear when market makers manipulate price to buy or sell an asset. It often covers a larger price range because it relies on a brief impulsive move to form.
Each type of order block has its own strengths and weaknesses. We provide traders with the flexibility to choose which types suit their trading style and preferences.
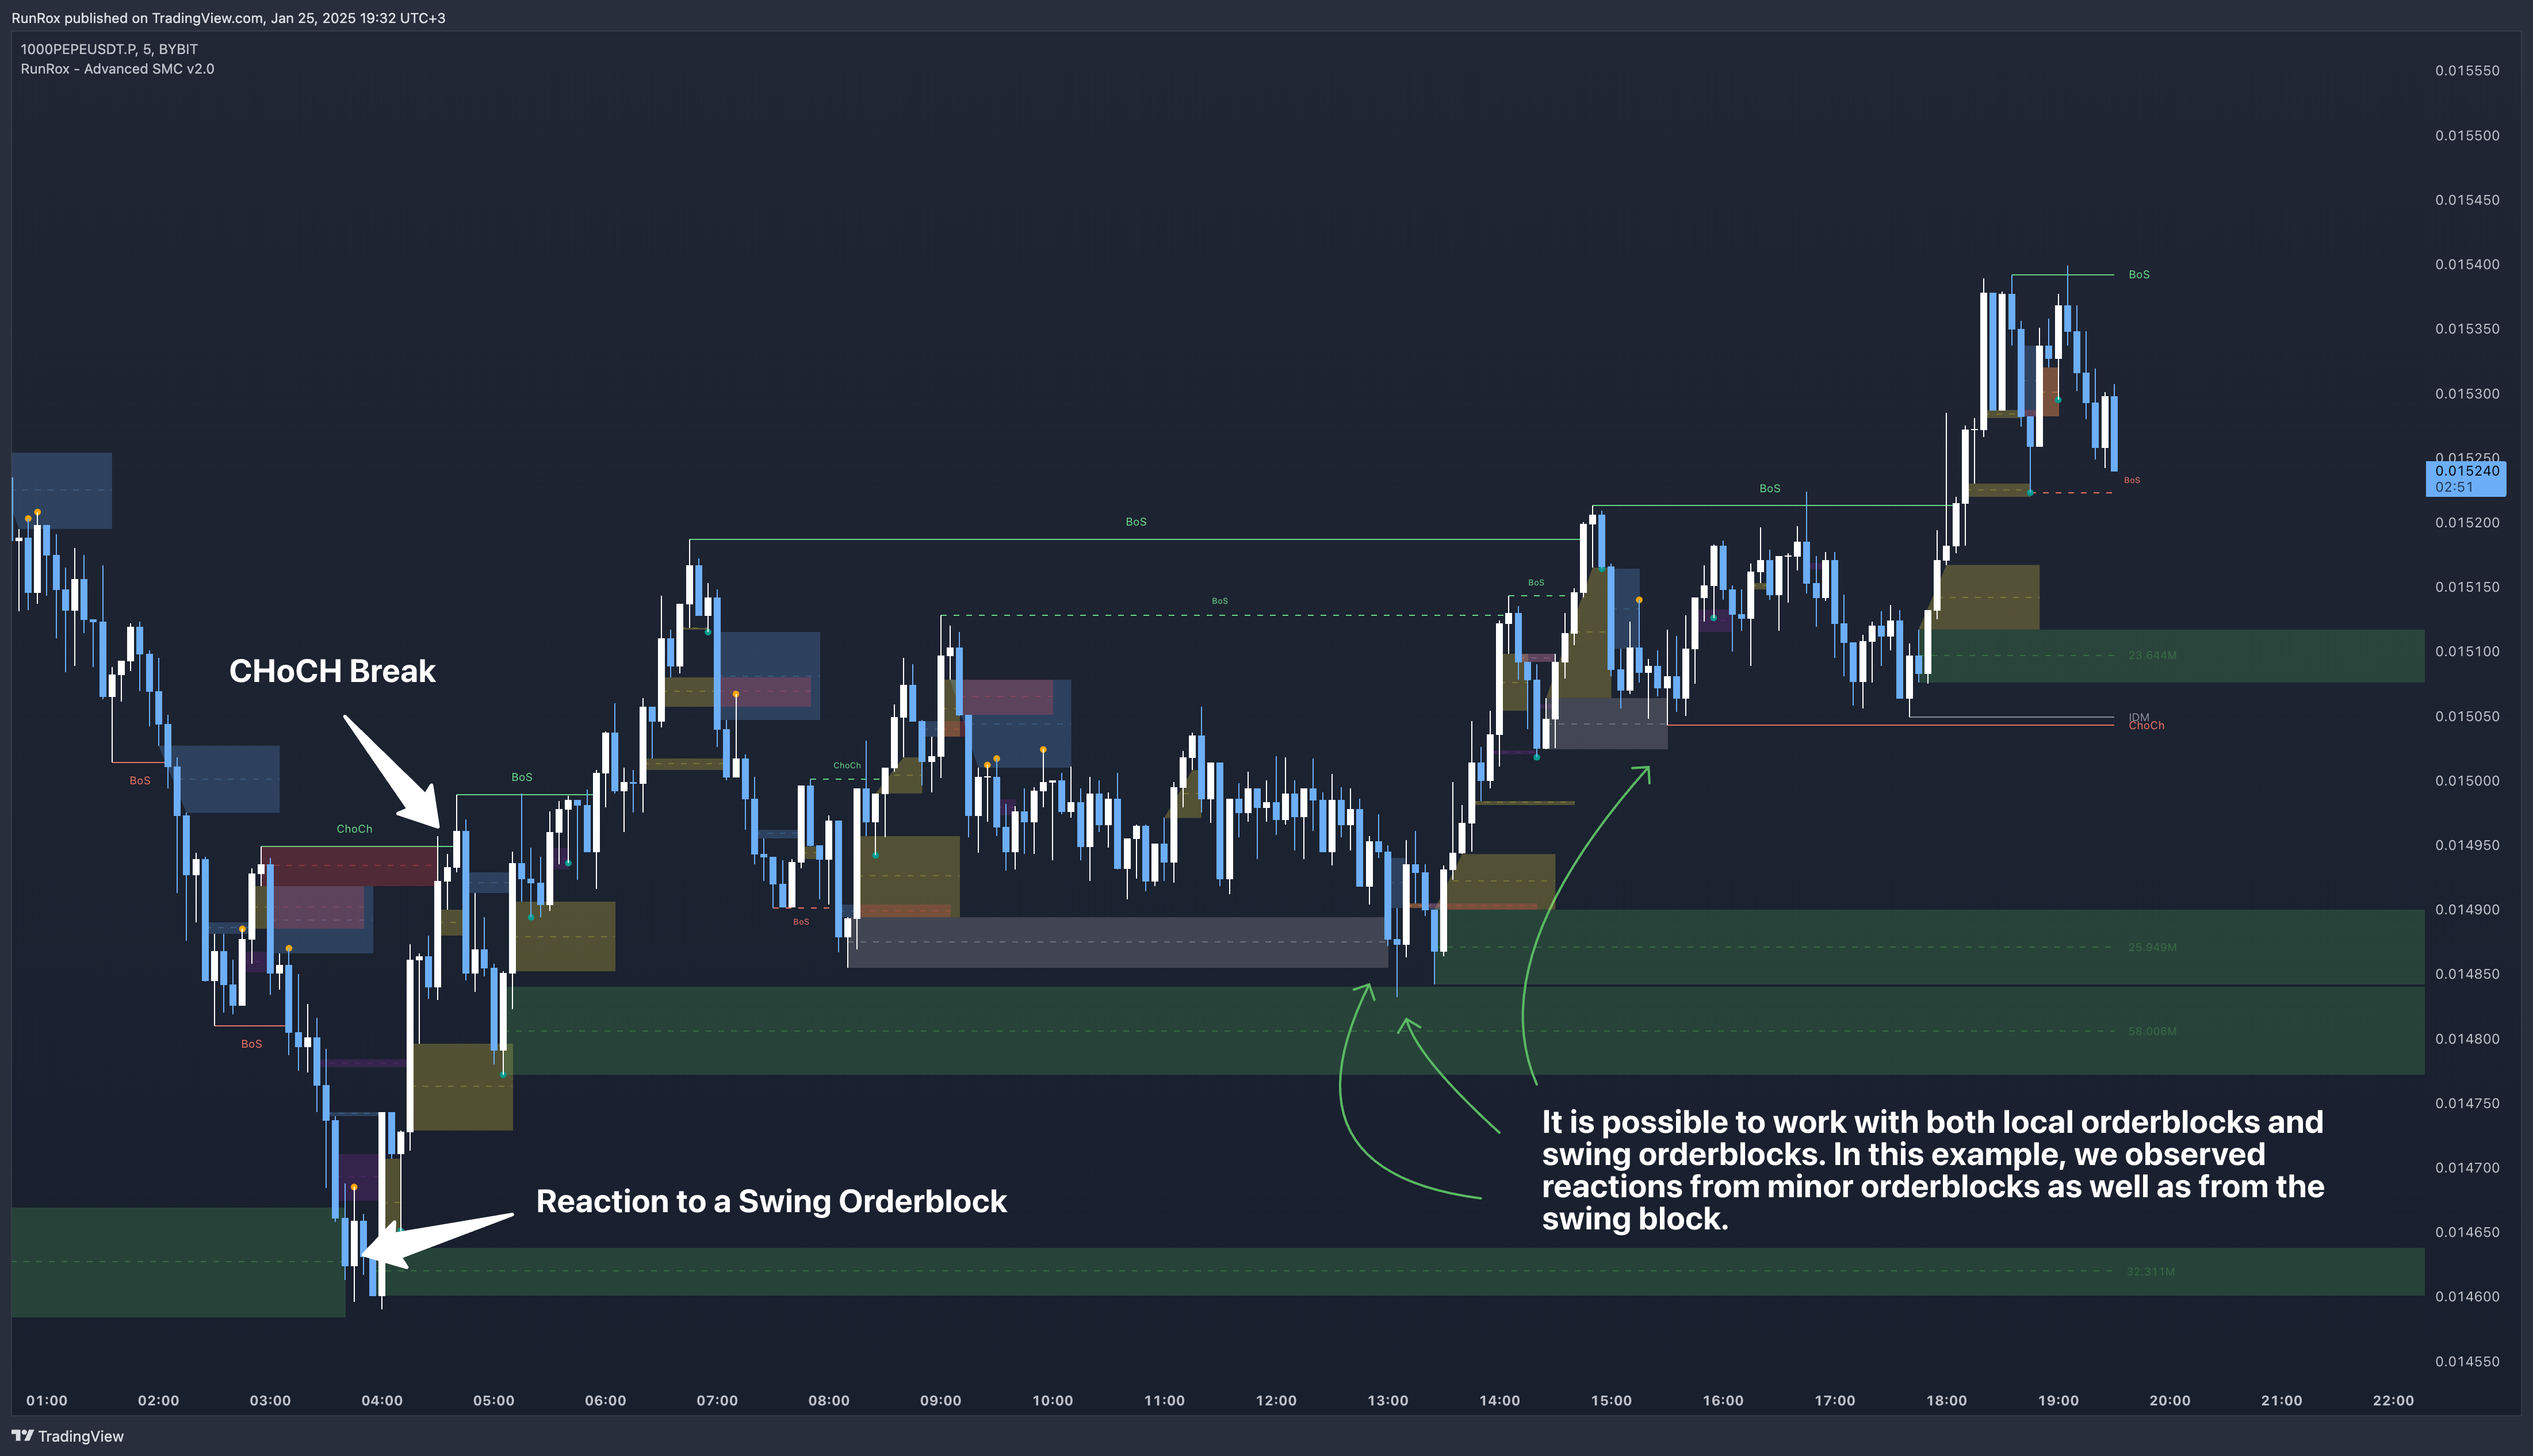
In this demonstration, we have highlighted the Advanced Orderblock as an illustration.
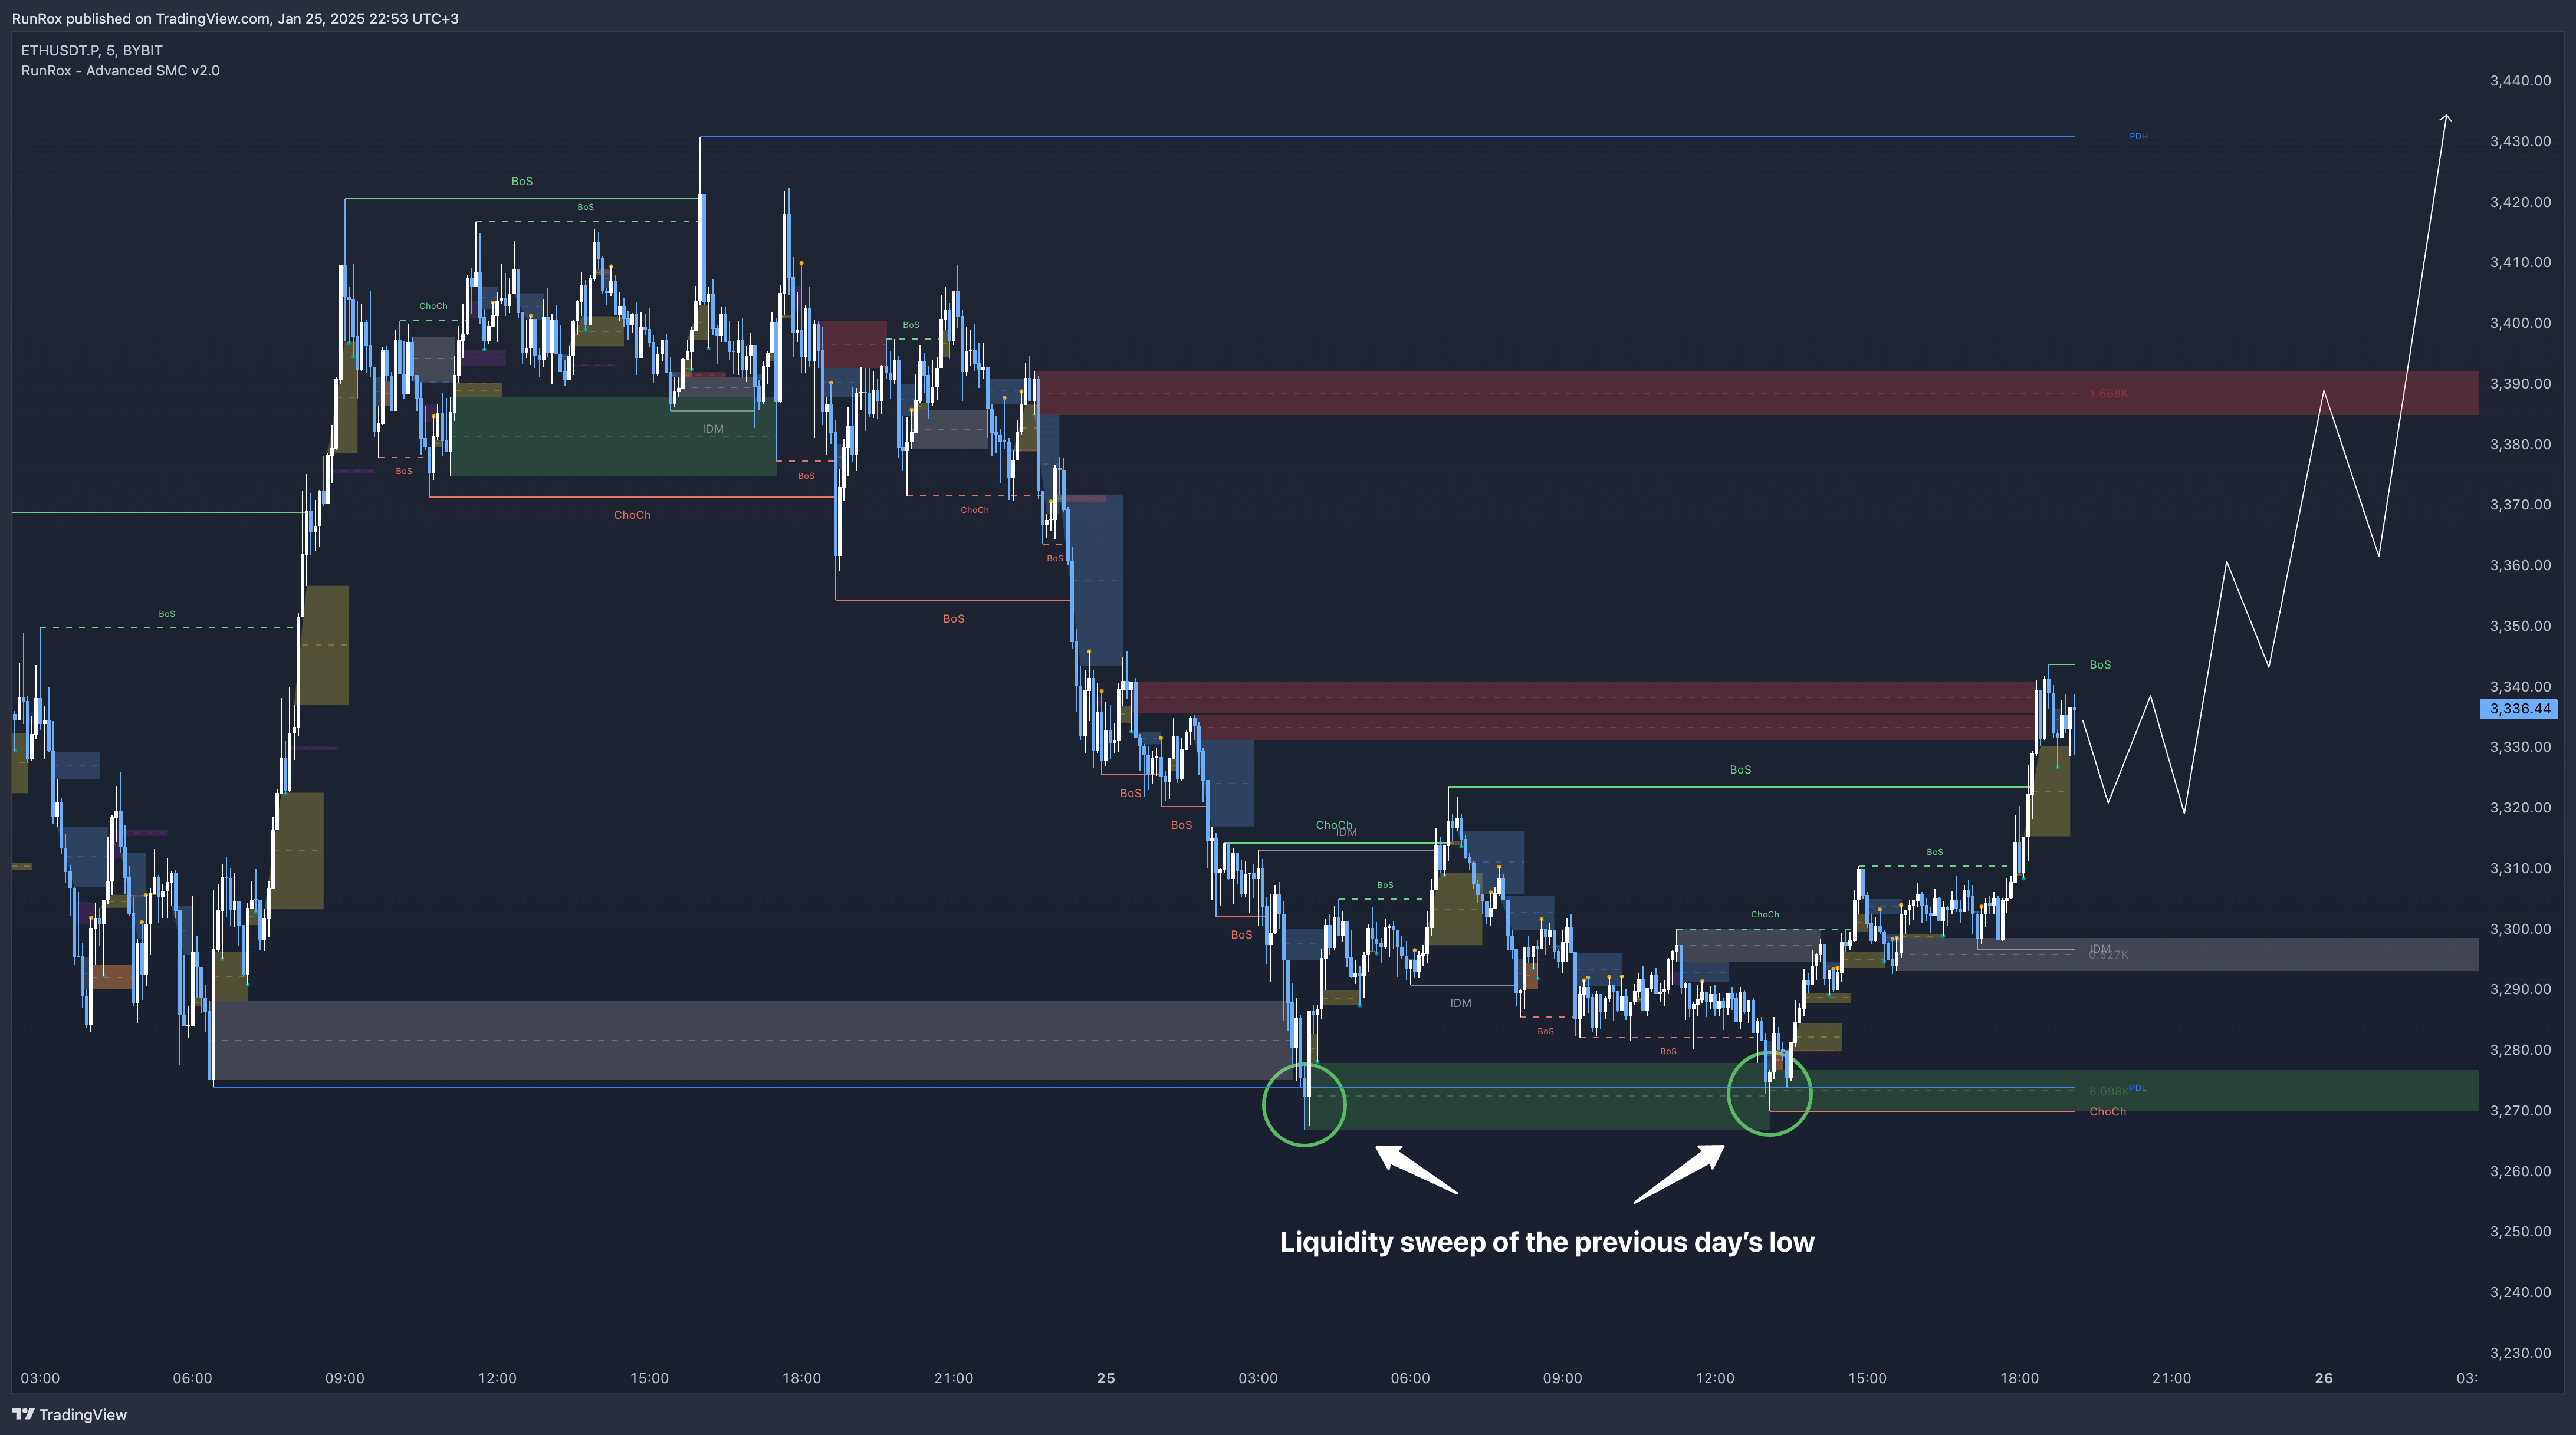
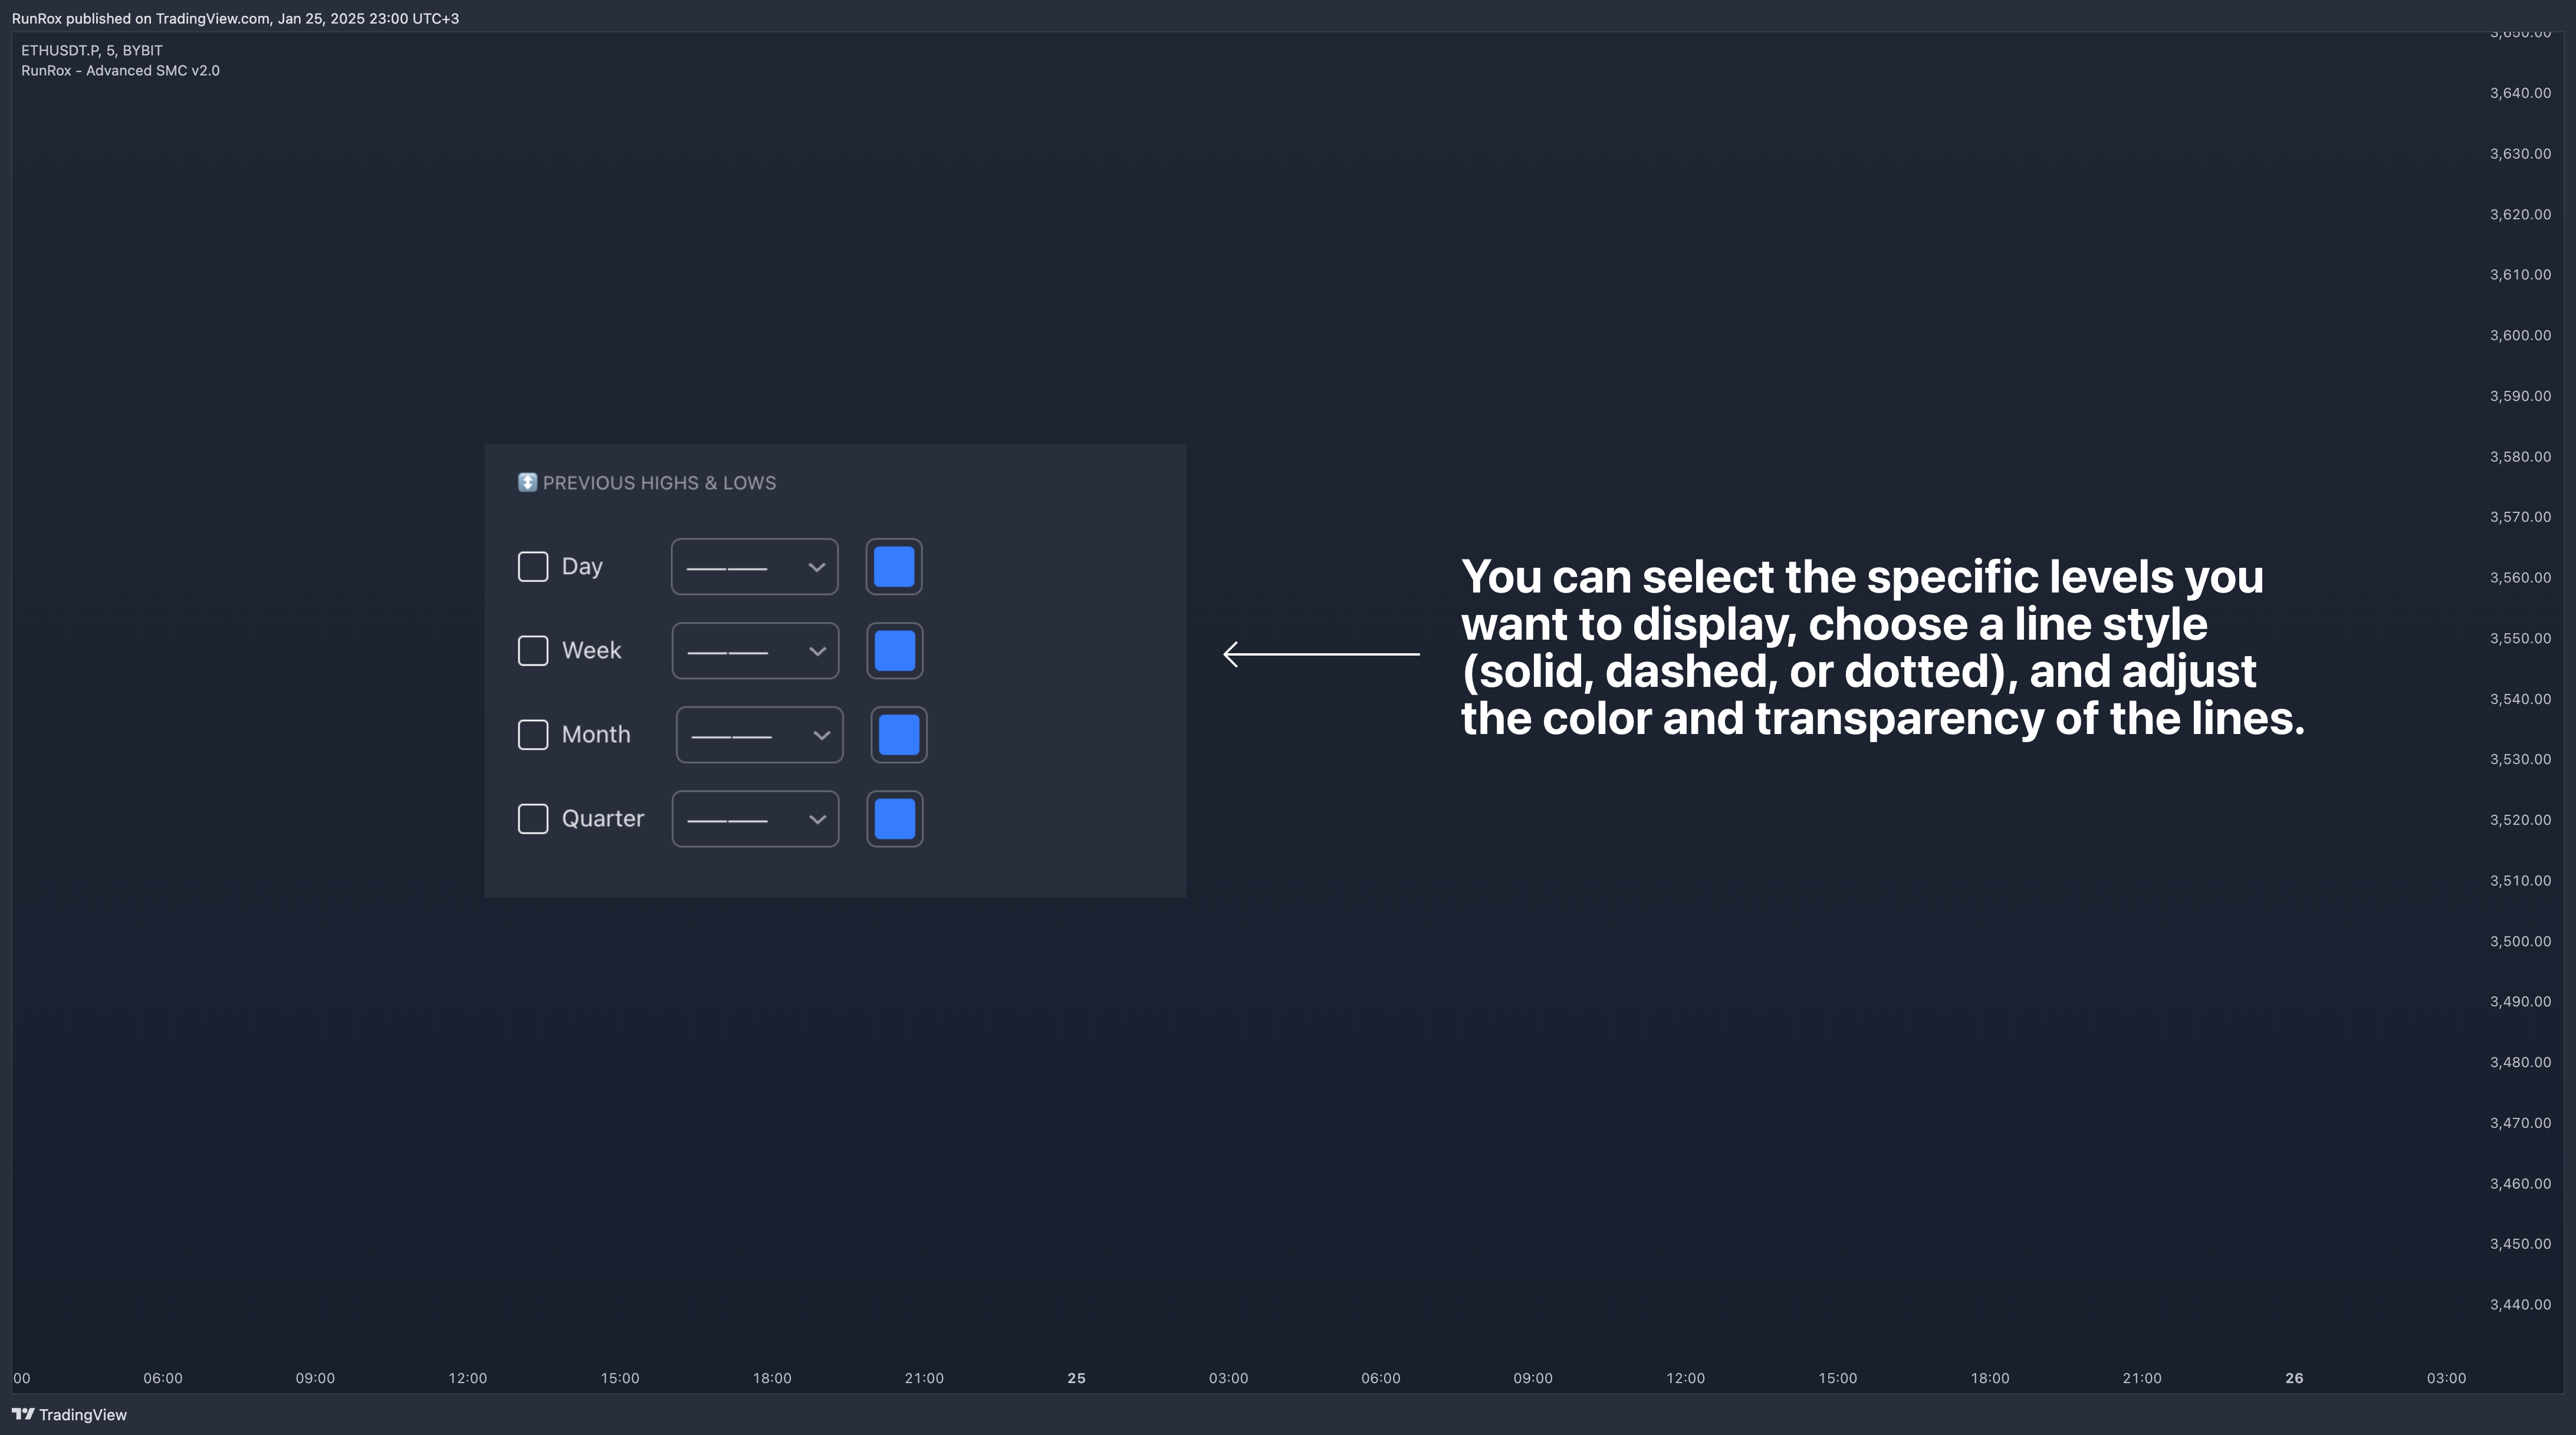
📏 Previous Highs and Lows
You can select four levels to display on the chart as some of the most liquid zones:
- Daily Highs and Lows
- Weekly Highs and Lows
- Monthly Highs and Lows
- Quarterly Highs and Lows
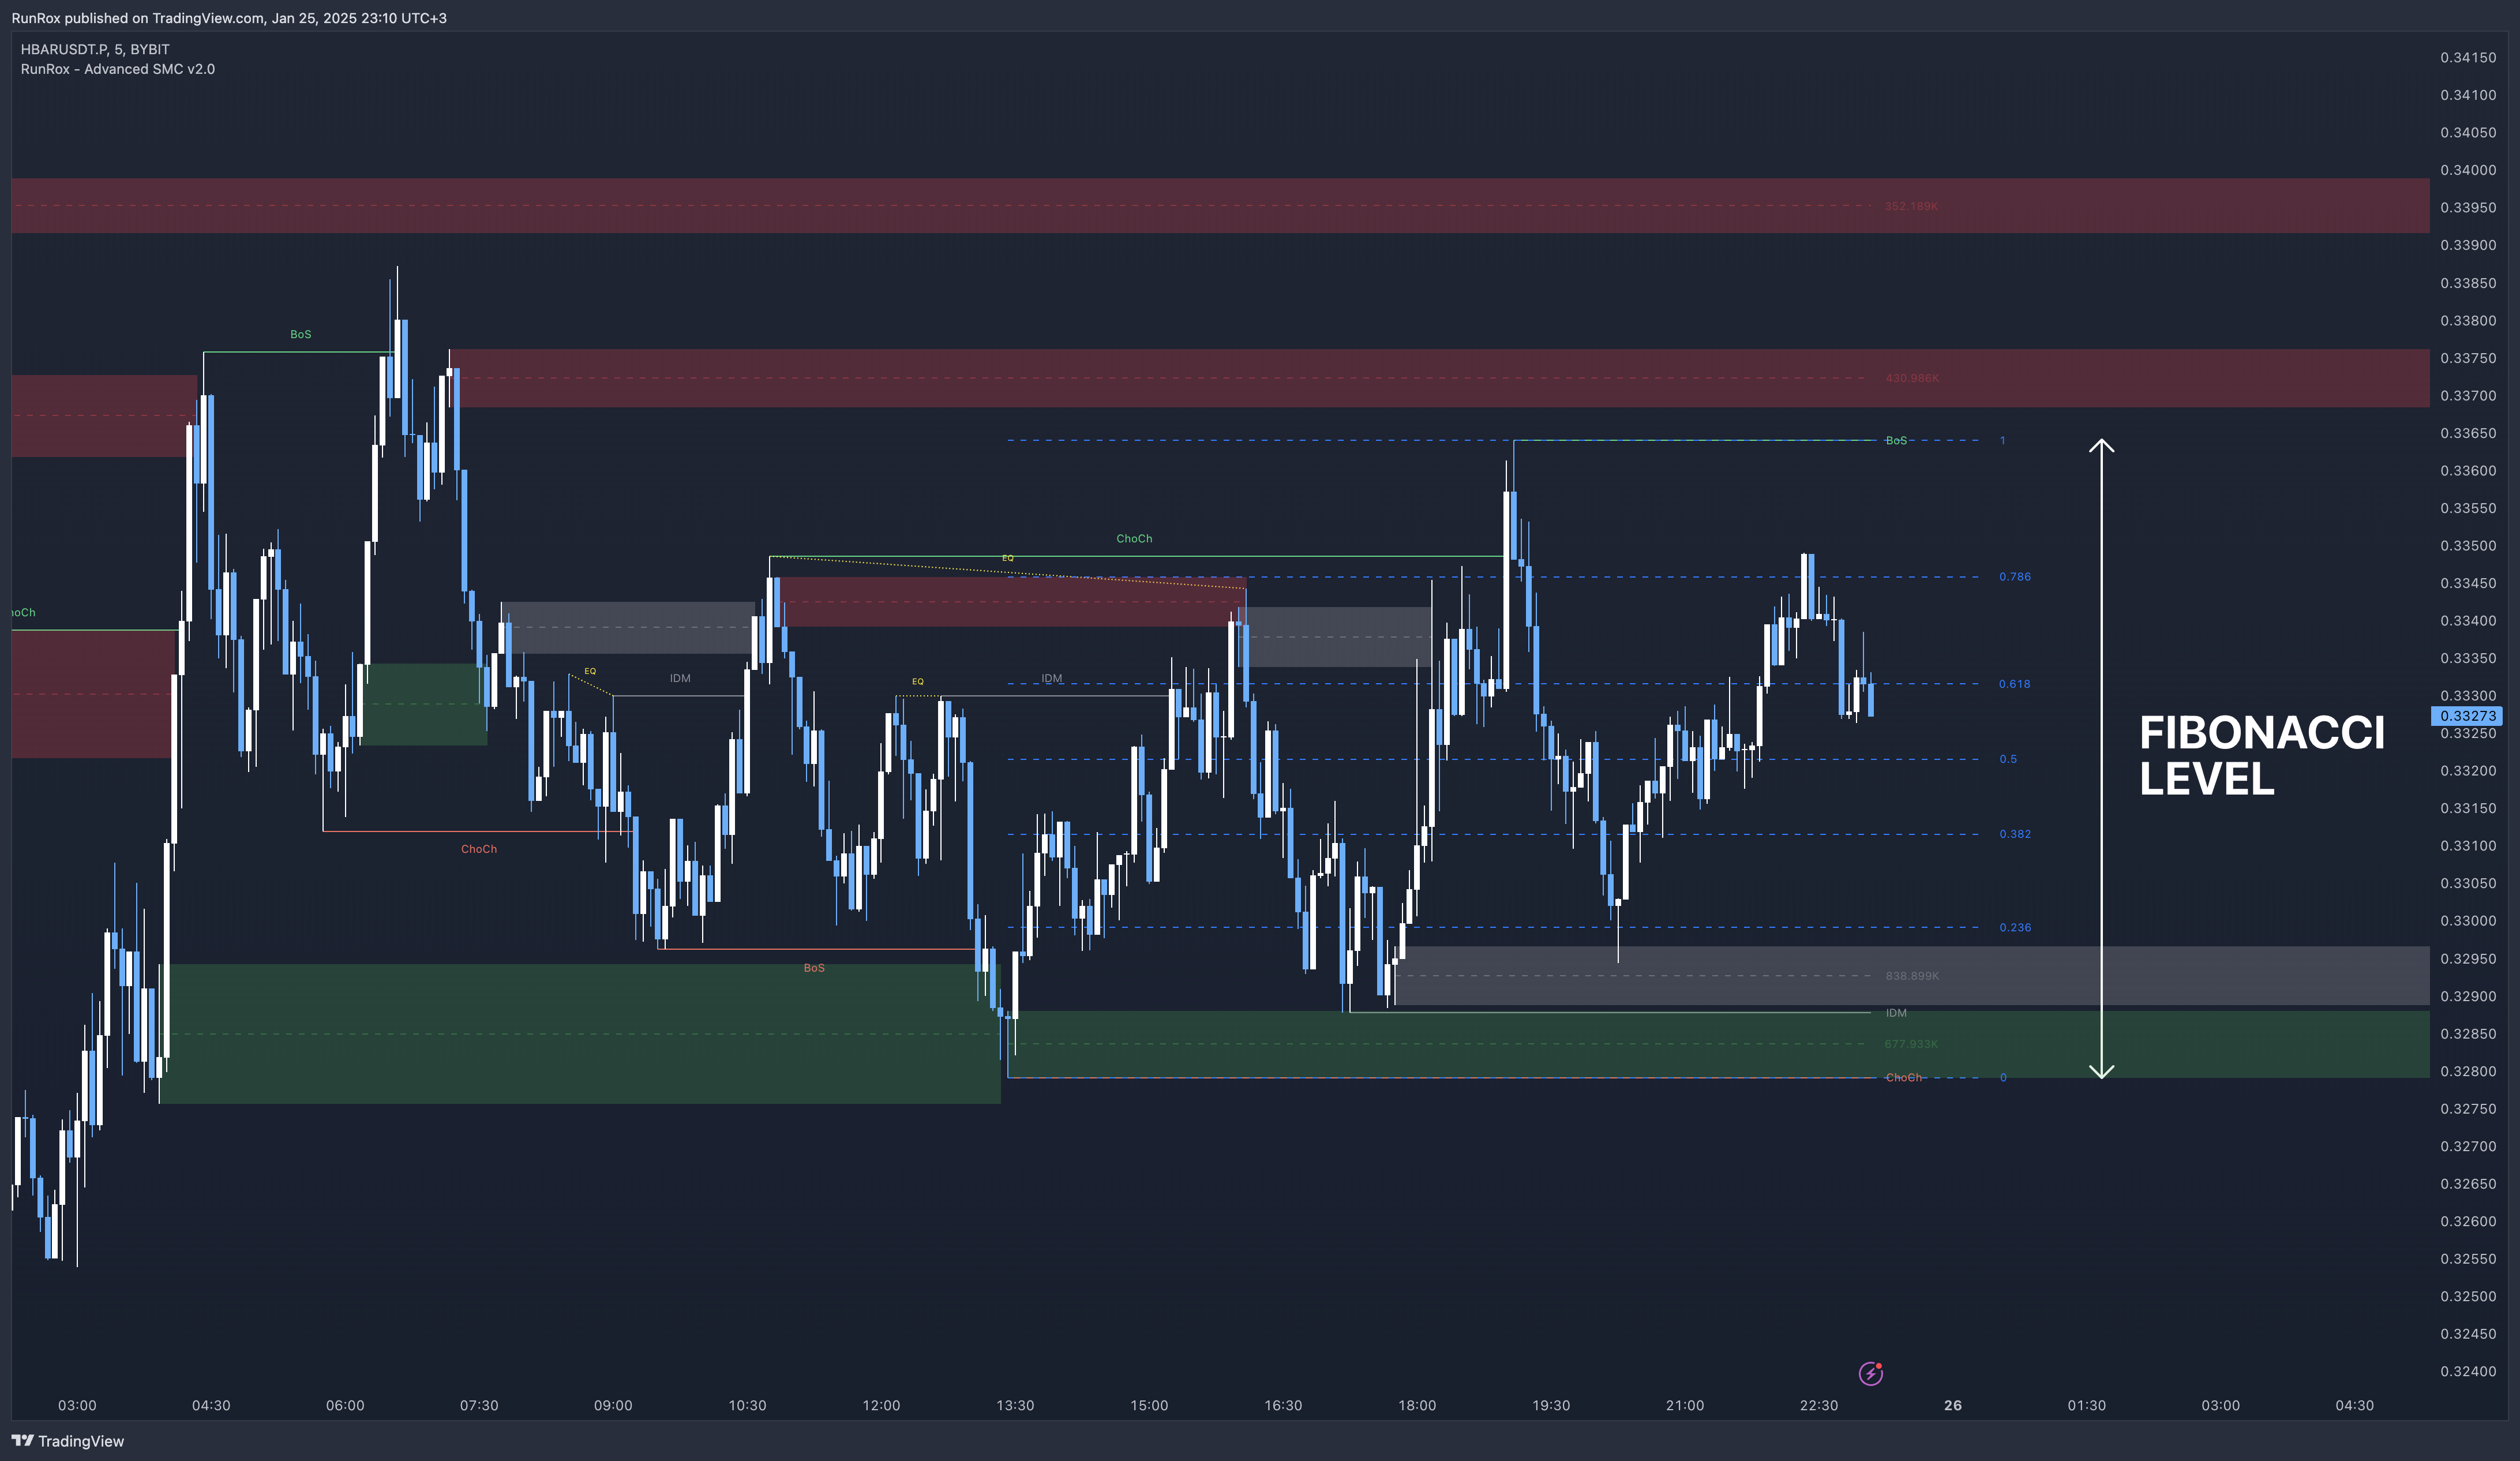
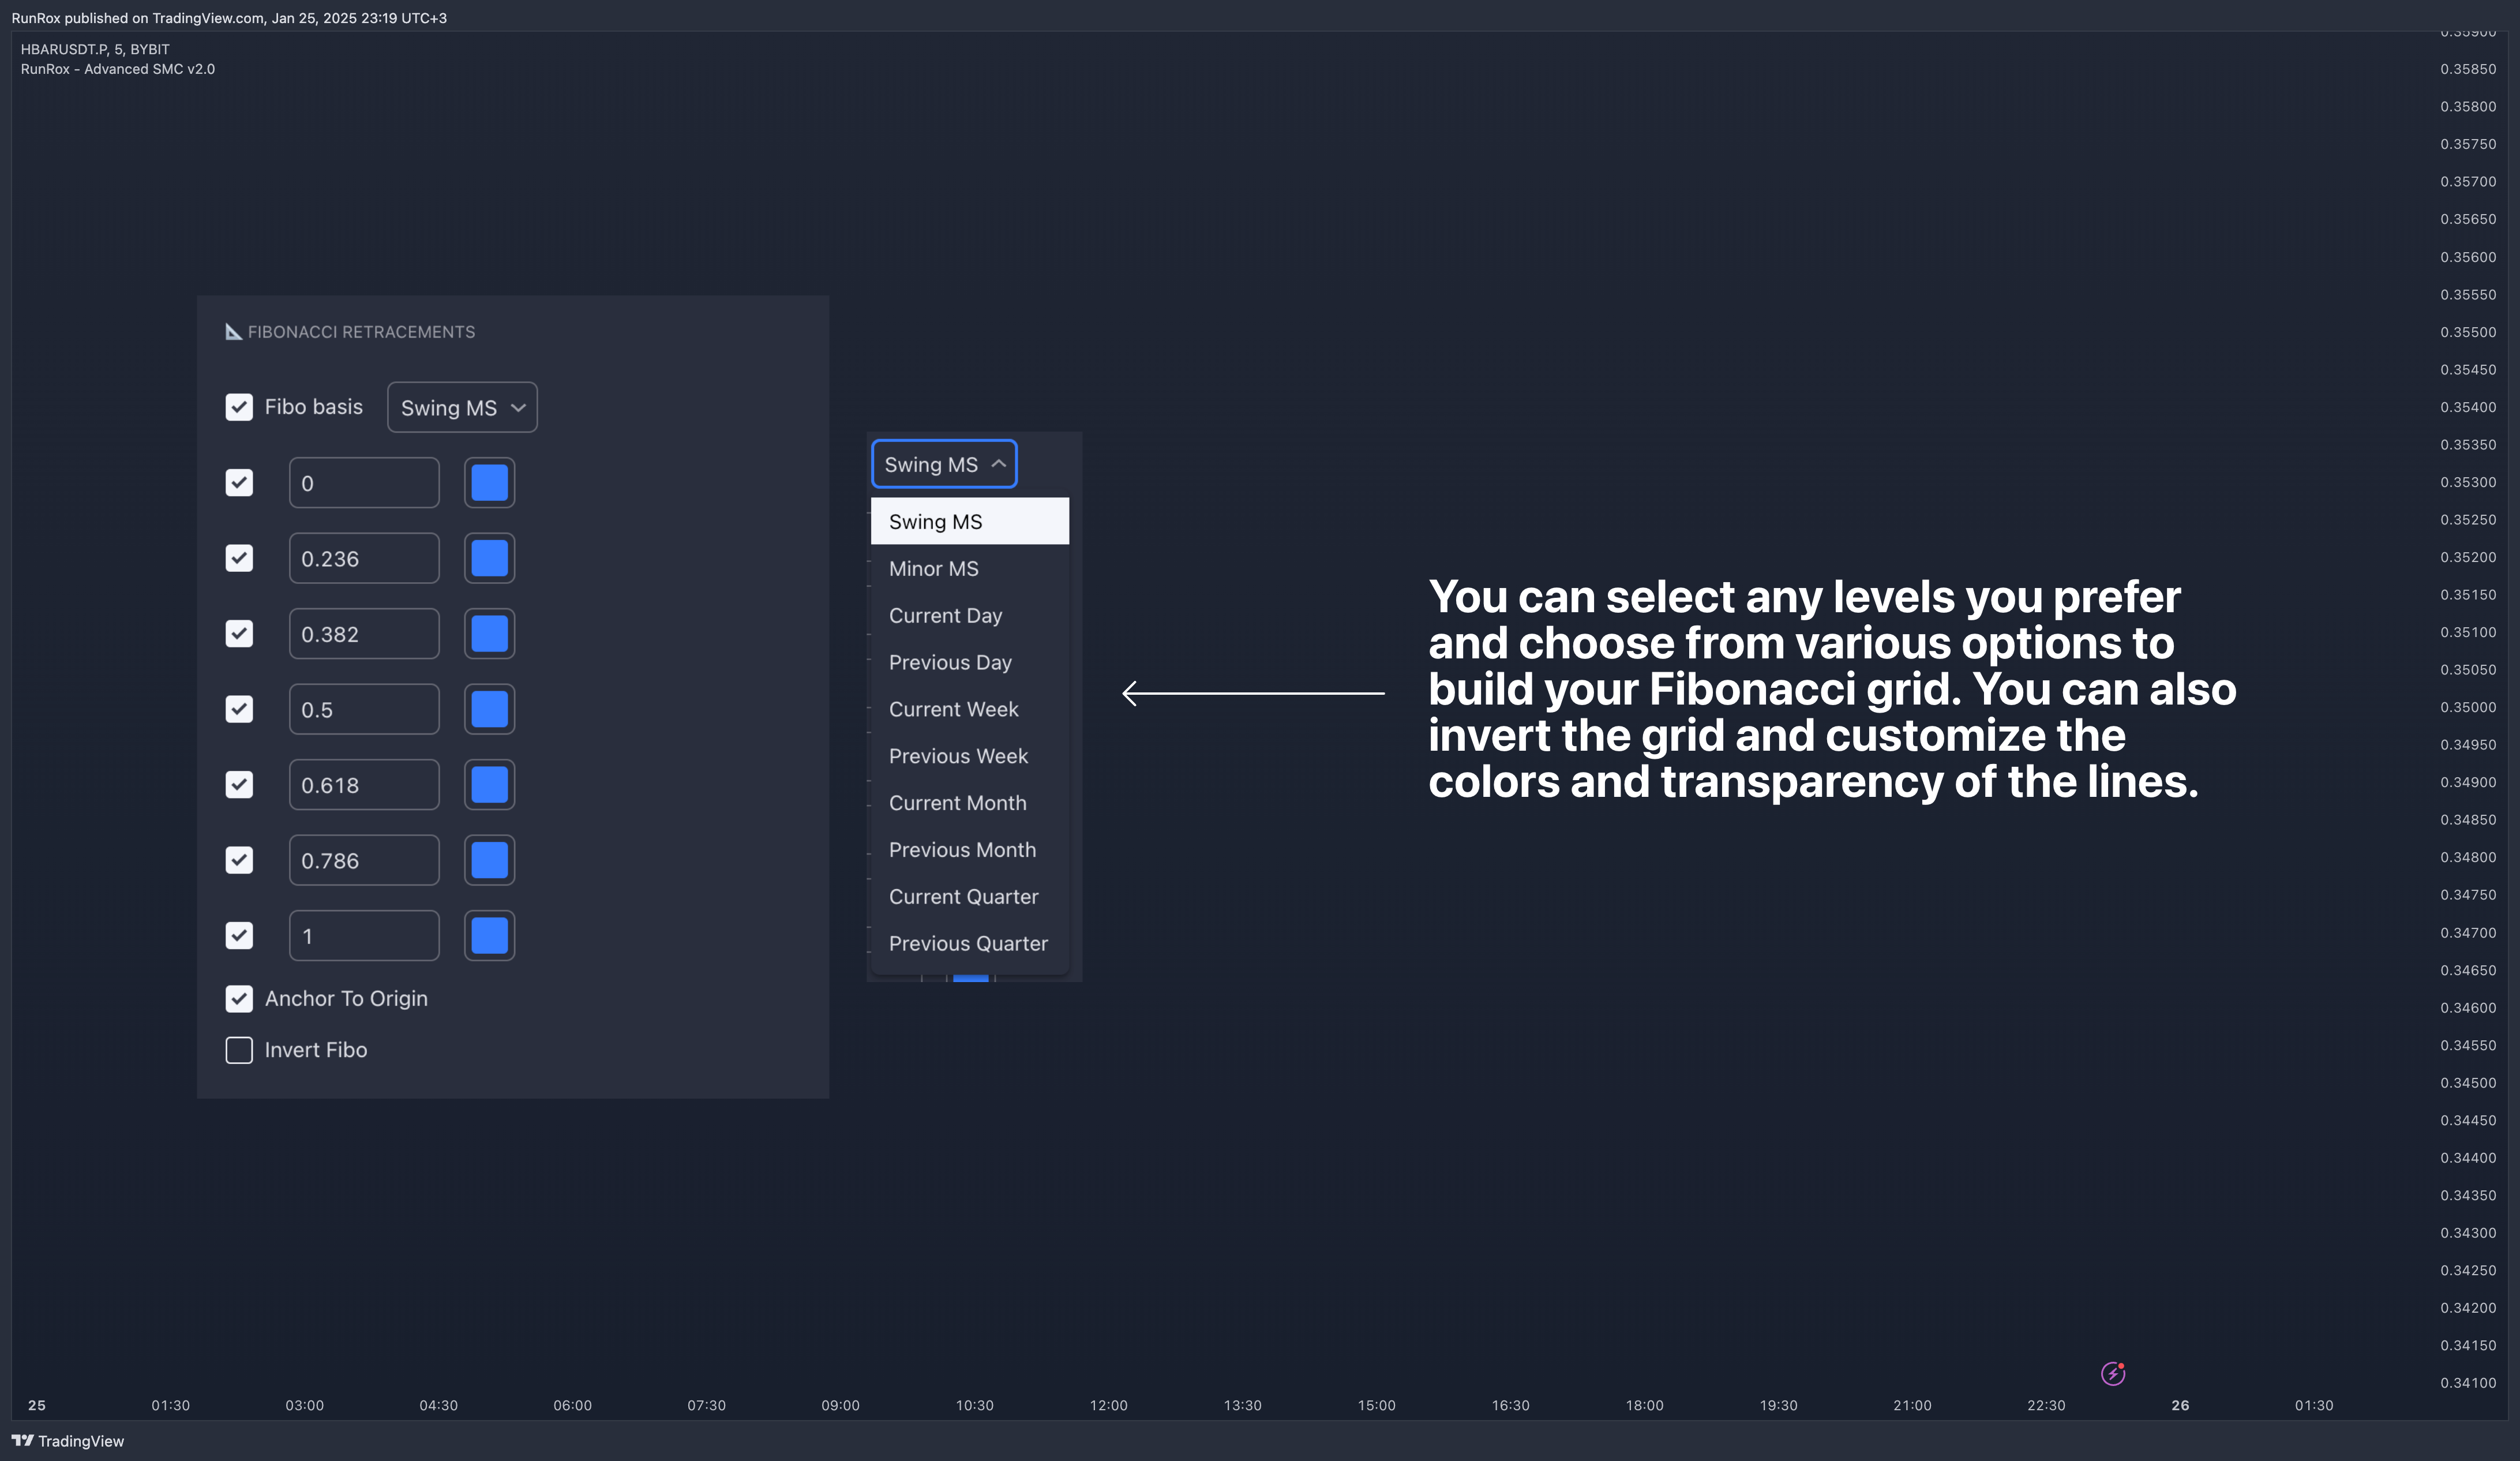
Likewise, a new section in our indicator is Fibonacci Levels, a well-known tool recognized as a reliable source of important levels on the chart. We have added this functionality with the option to choose how you want to generate these levels and which specific levels you want to display.
You can plot Fibonacci levels based on the Swing structure, Minor structure, previous or current day, month, and more. In total, there are 10 different options for constructing the Fibonacci grid.
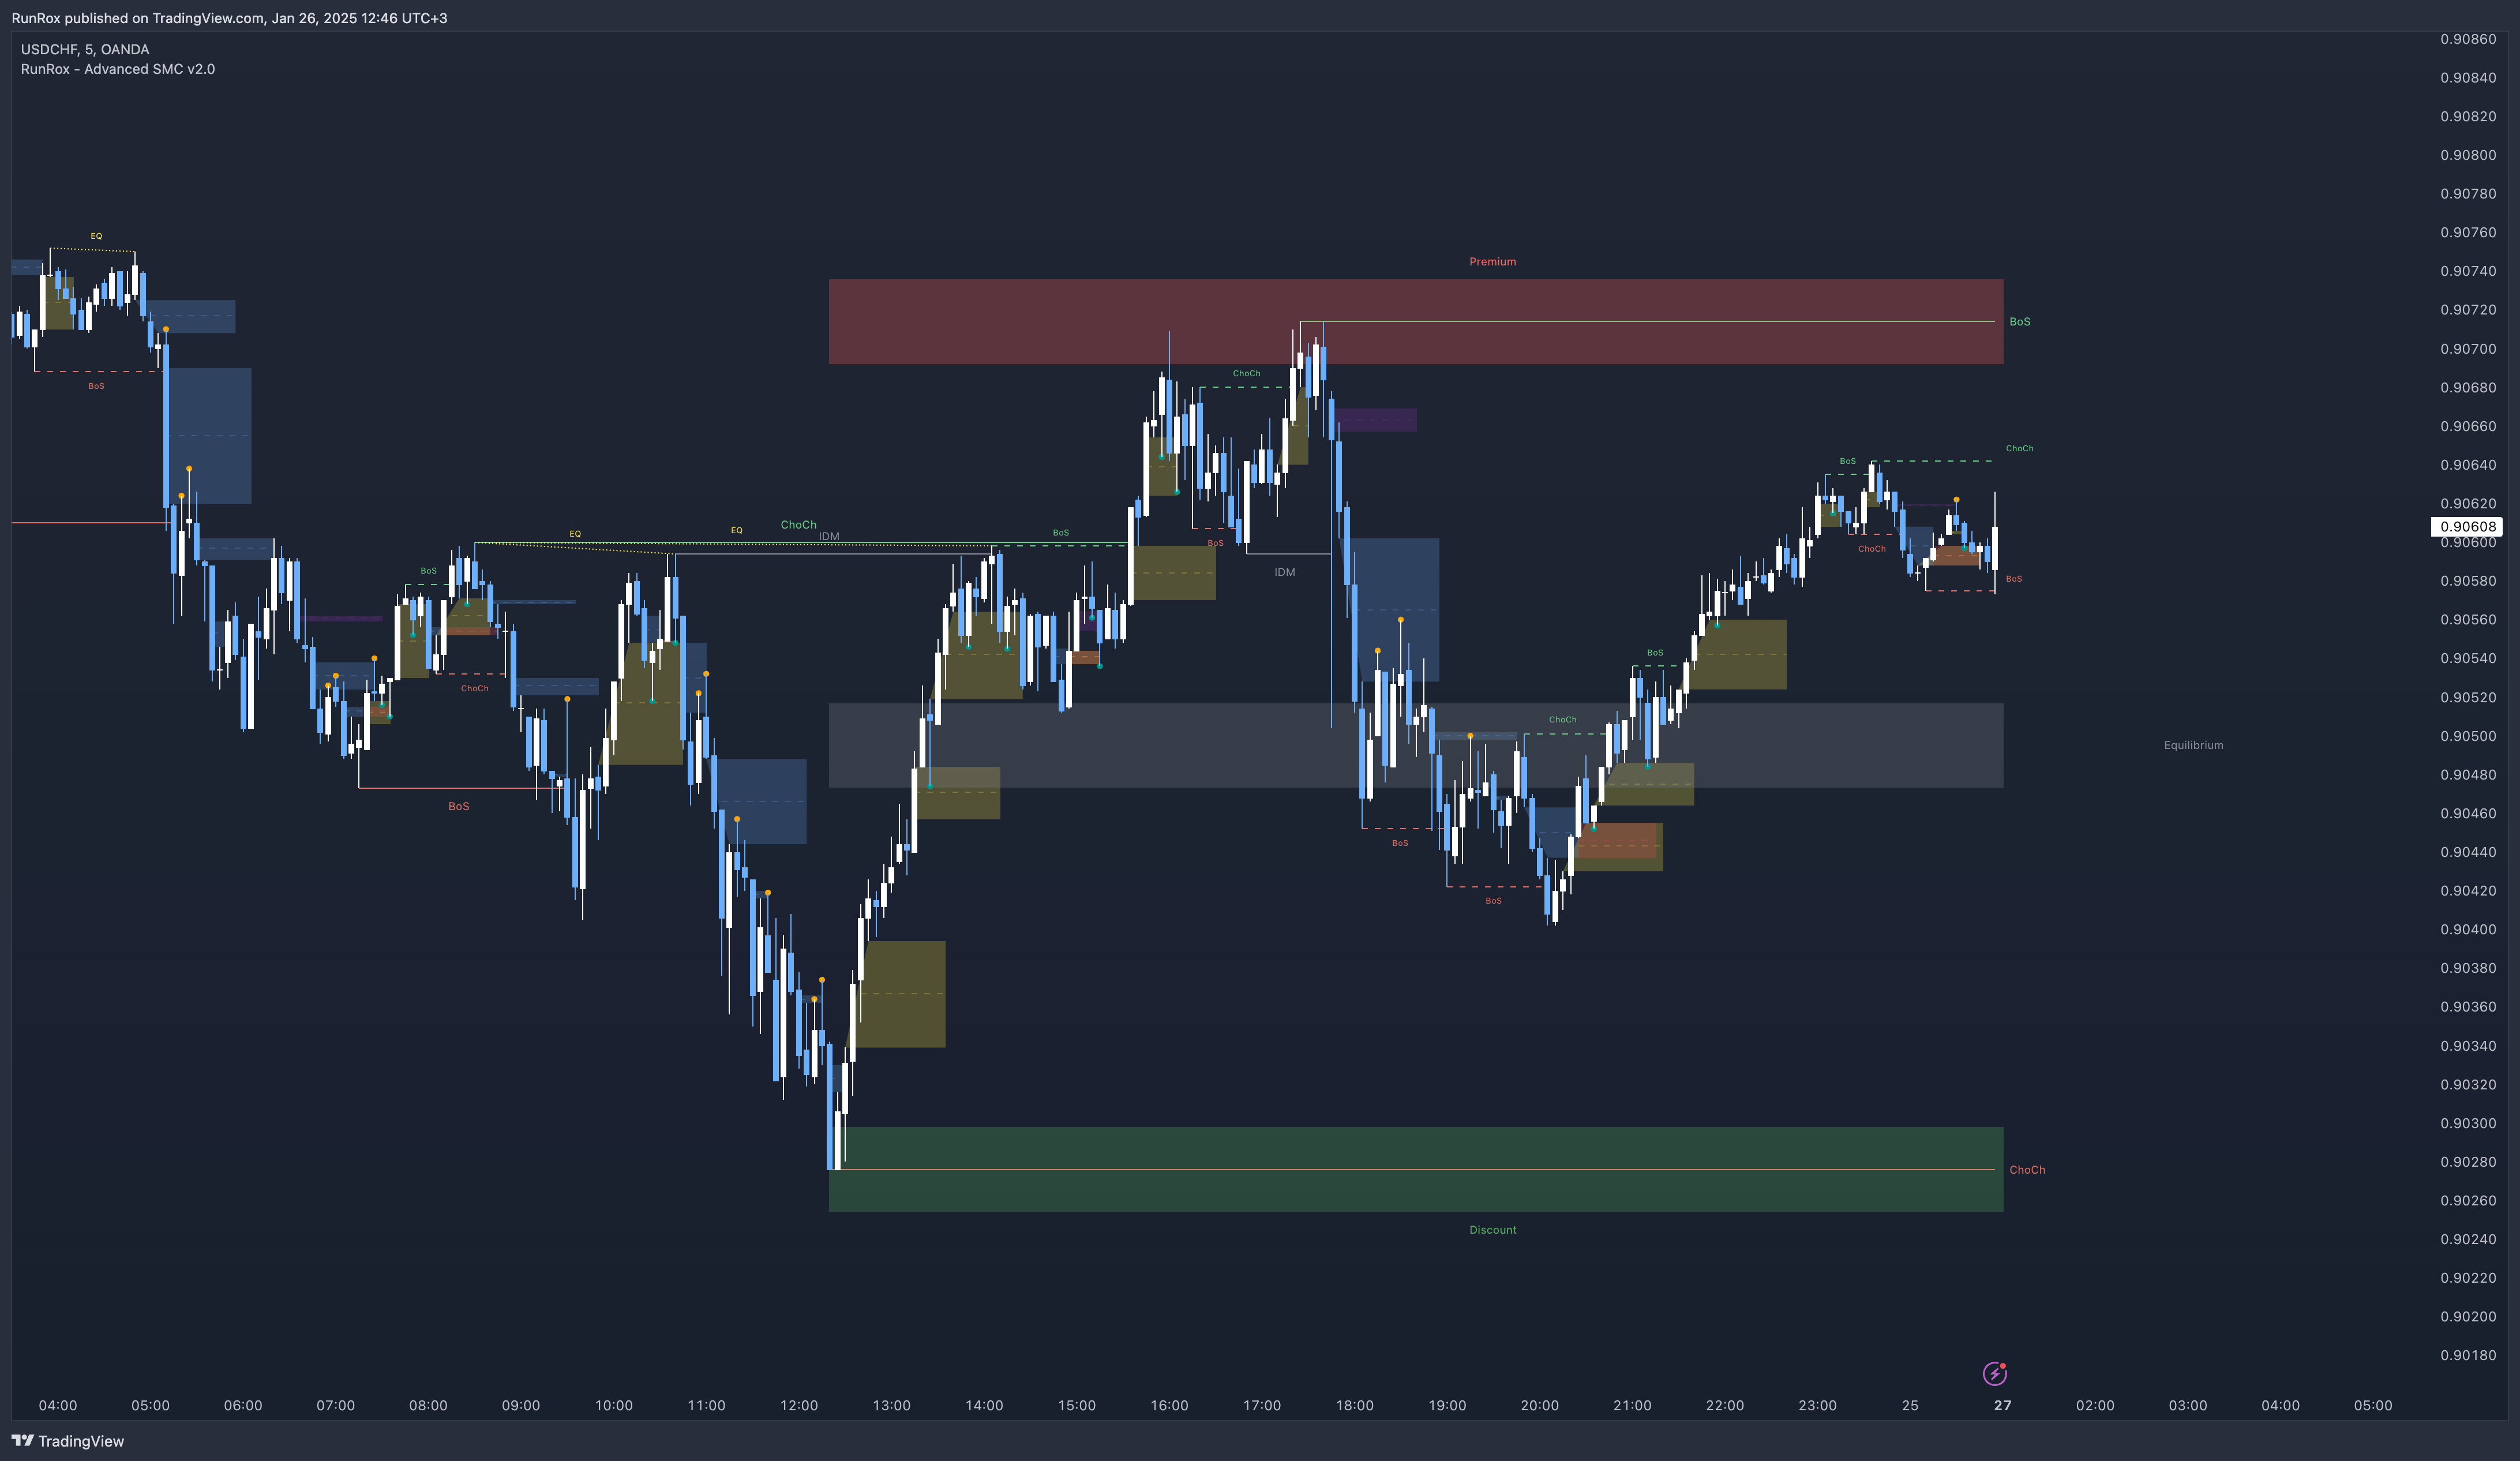
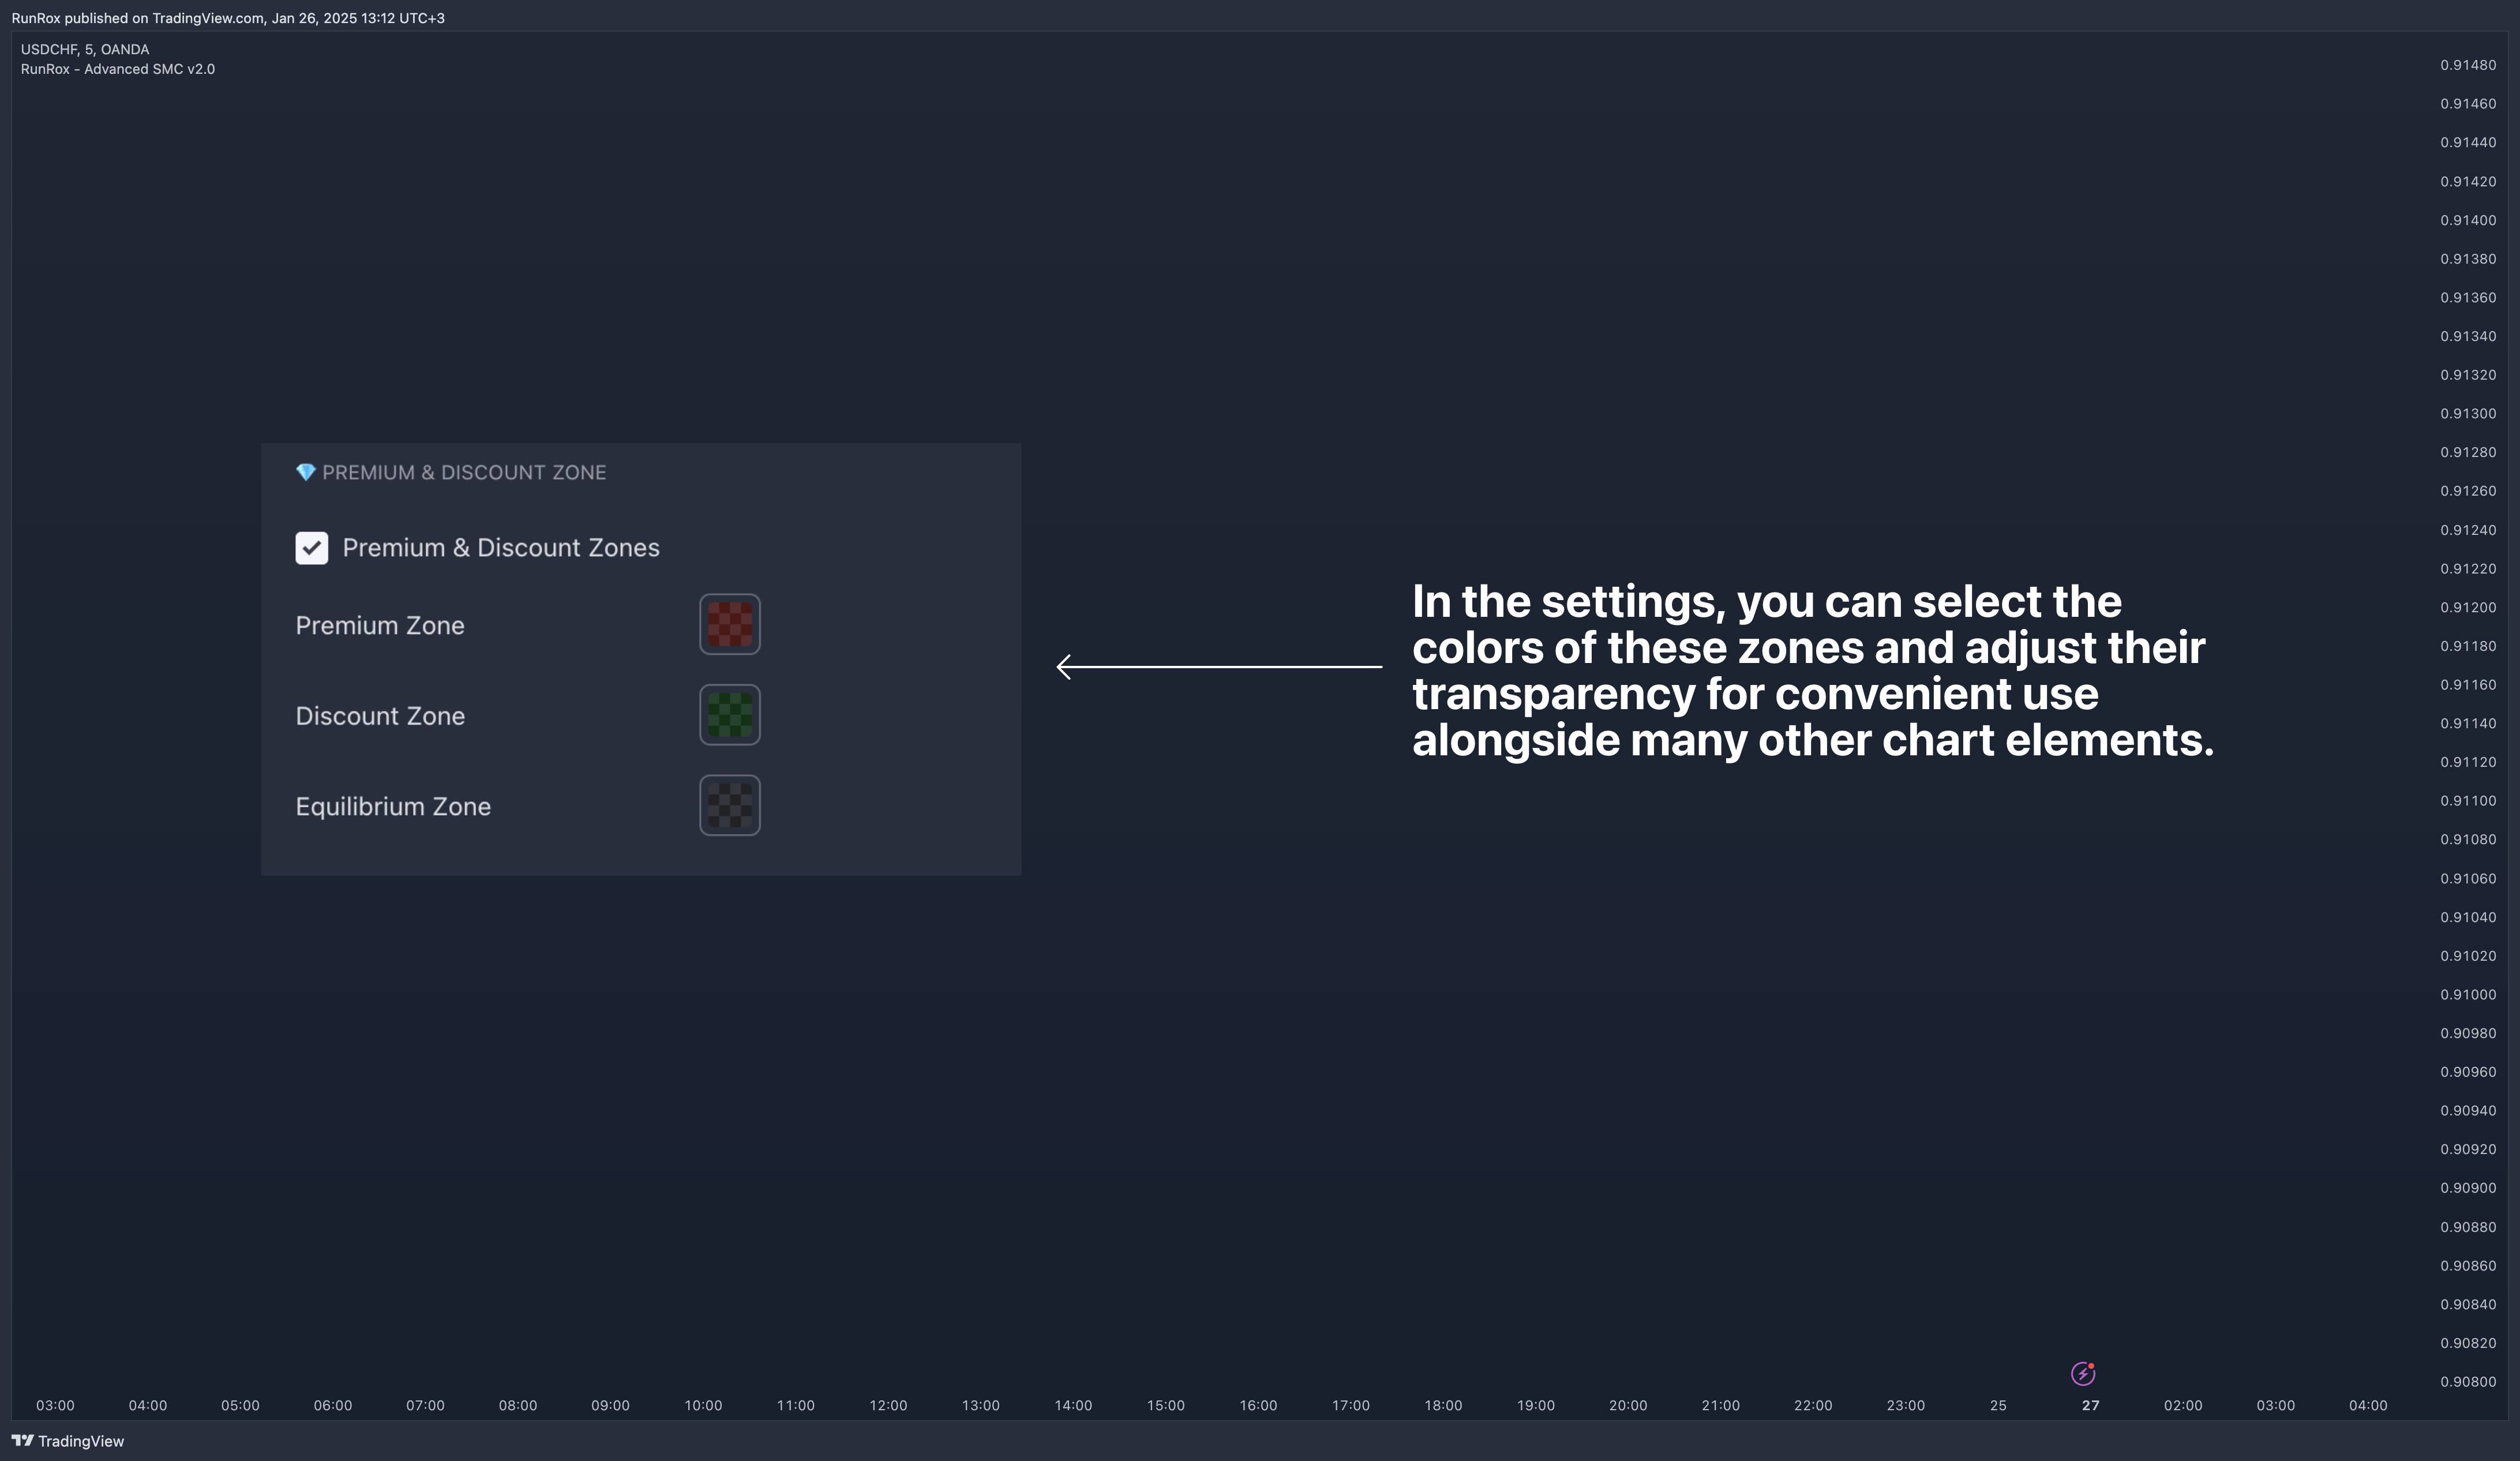
Another useful feature for all traders is the Premium and Discount zones based on structure. This makes it easy to identify areas of interest—whether in a discount or premium zone, or in an equilibrium area.