The primary concept of this indicator is liquidity analysis, making it ideal for Smart Money traders and for trading within market structure. At the same time, the indicator is universal and can be integrated into any strategy. Below, I will outline the full concept of the indicator and its settings so you can better understand how it works. CONCEPT
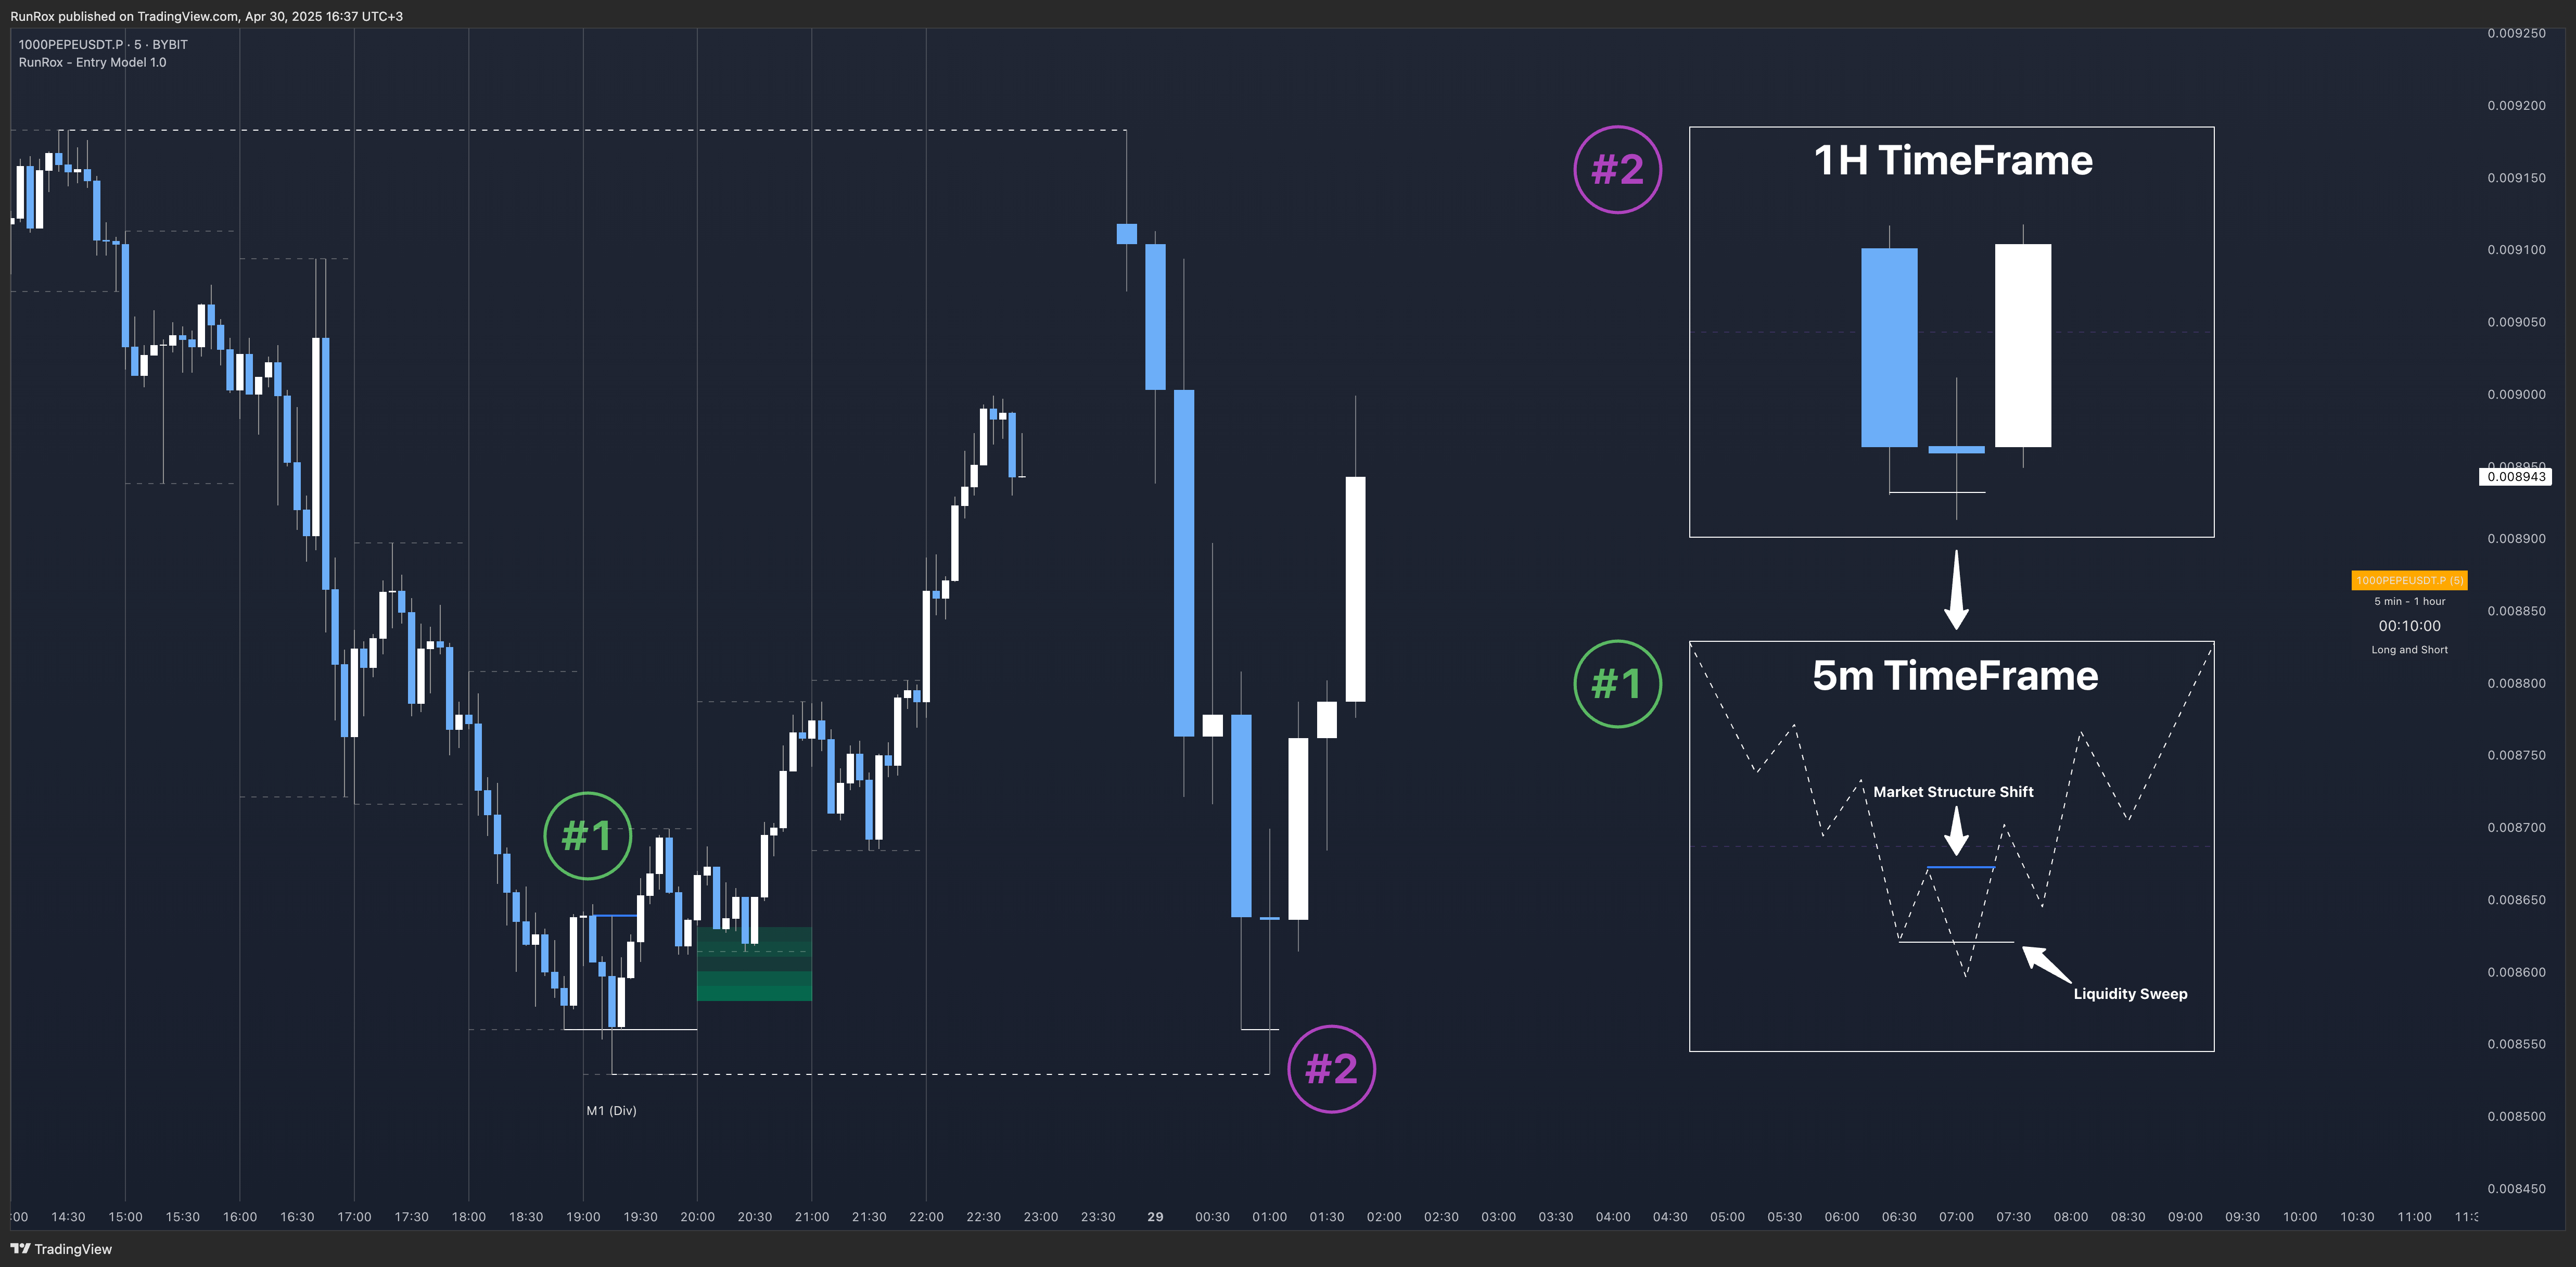
In the screenshot below, I’ll schematically illustrate the core idea of this indicator. It’s one of the patterns that the indicator automatically detects on the chart using a two-timeframe approach. We use the higher timeframe to identify liquidity zones, and the lower timeframe to capture liquidity removal and structure breaks. The schematic is shown in the screenshot below.