NDICATOR FEATURES

Identification of 3 pattern sets:

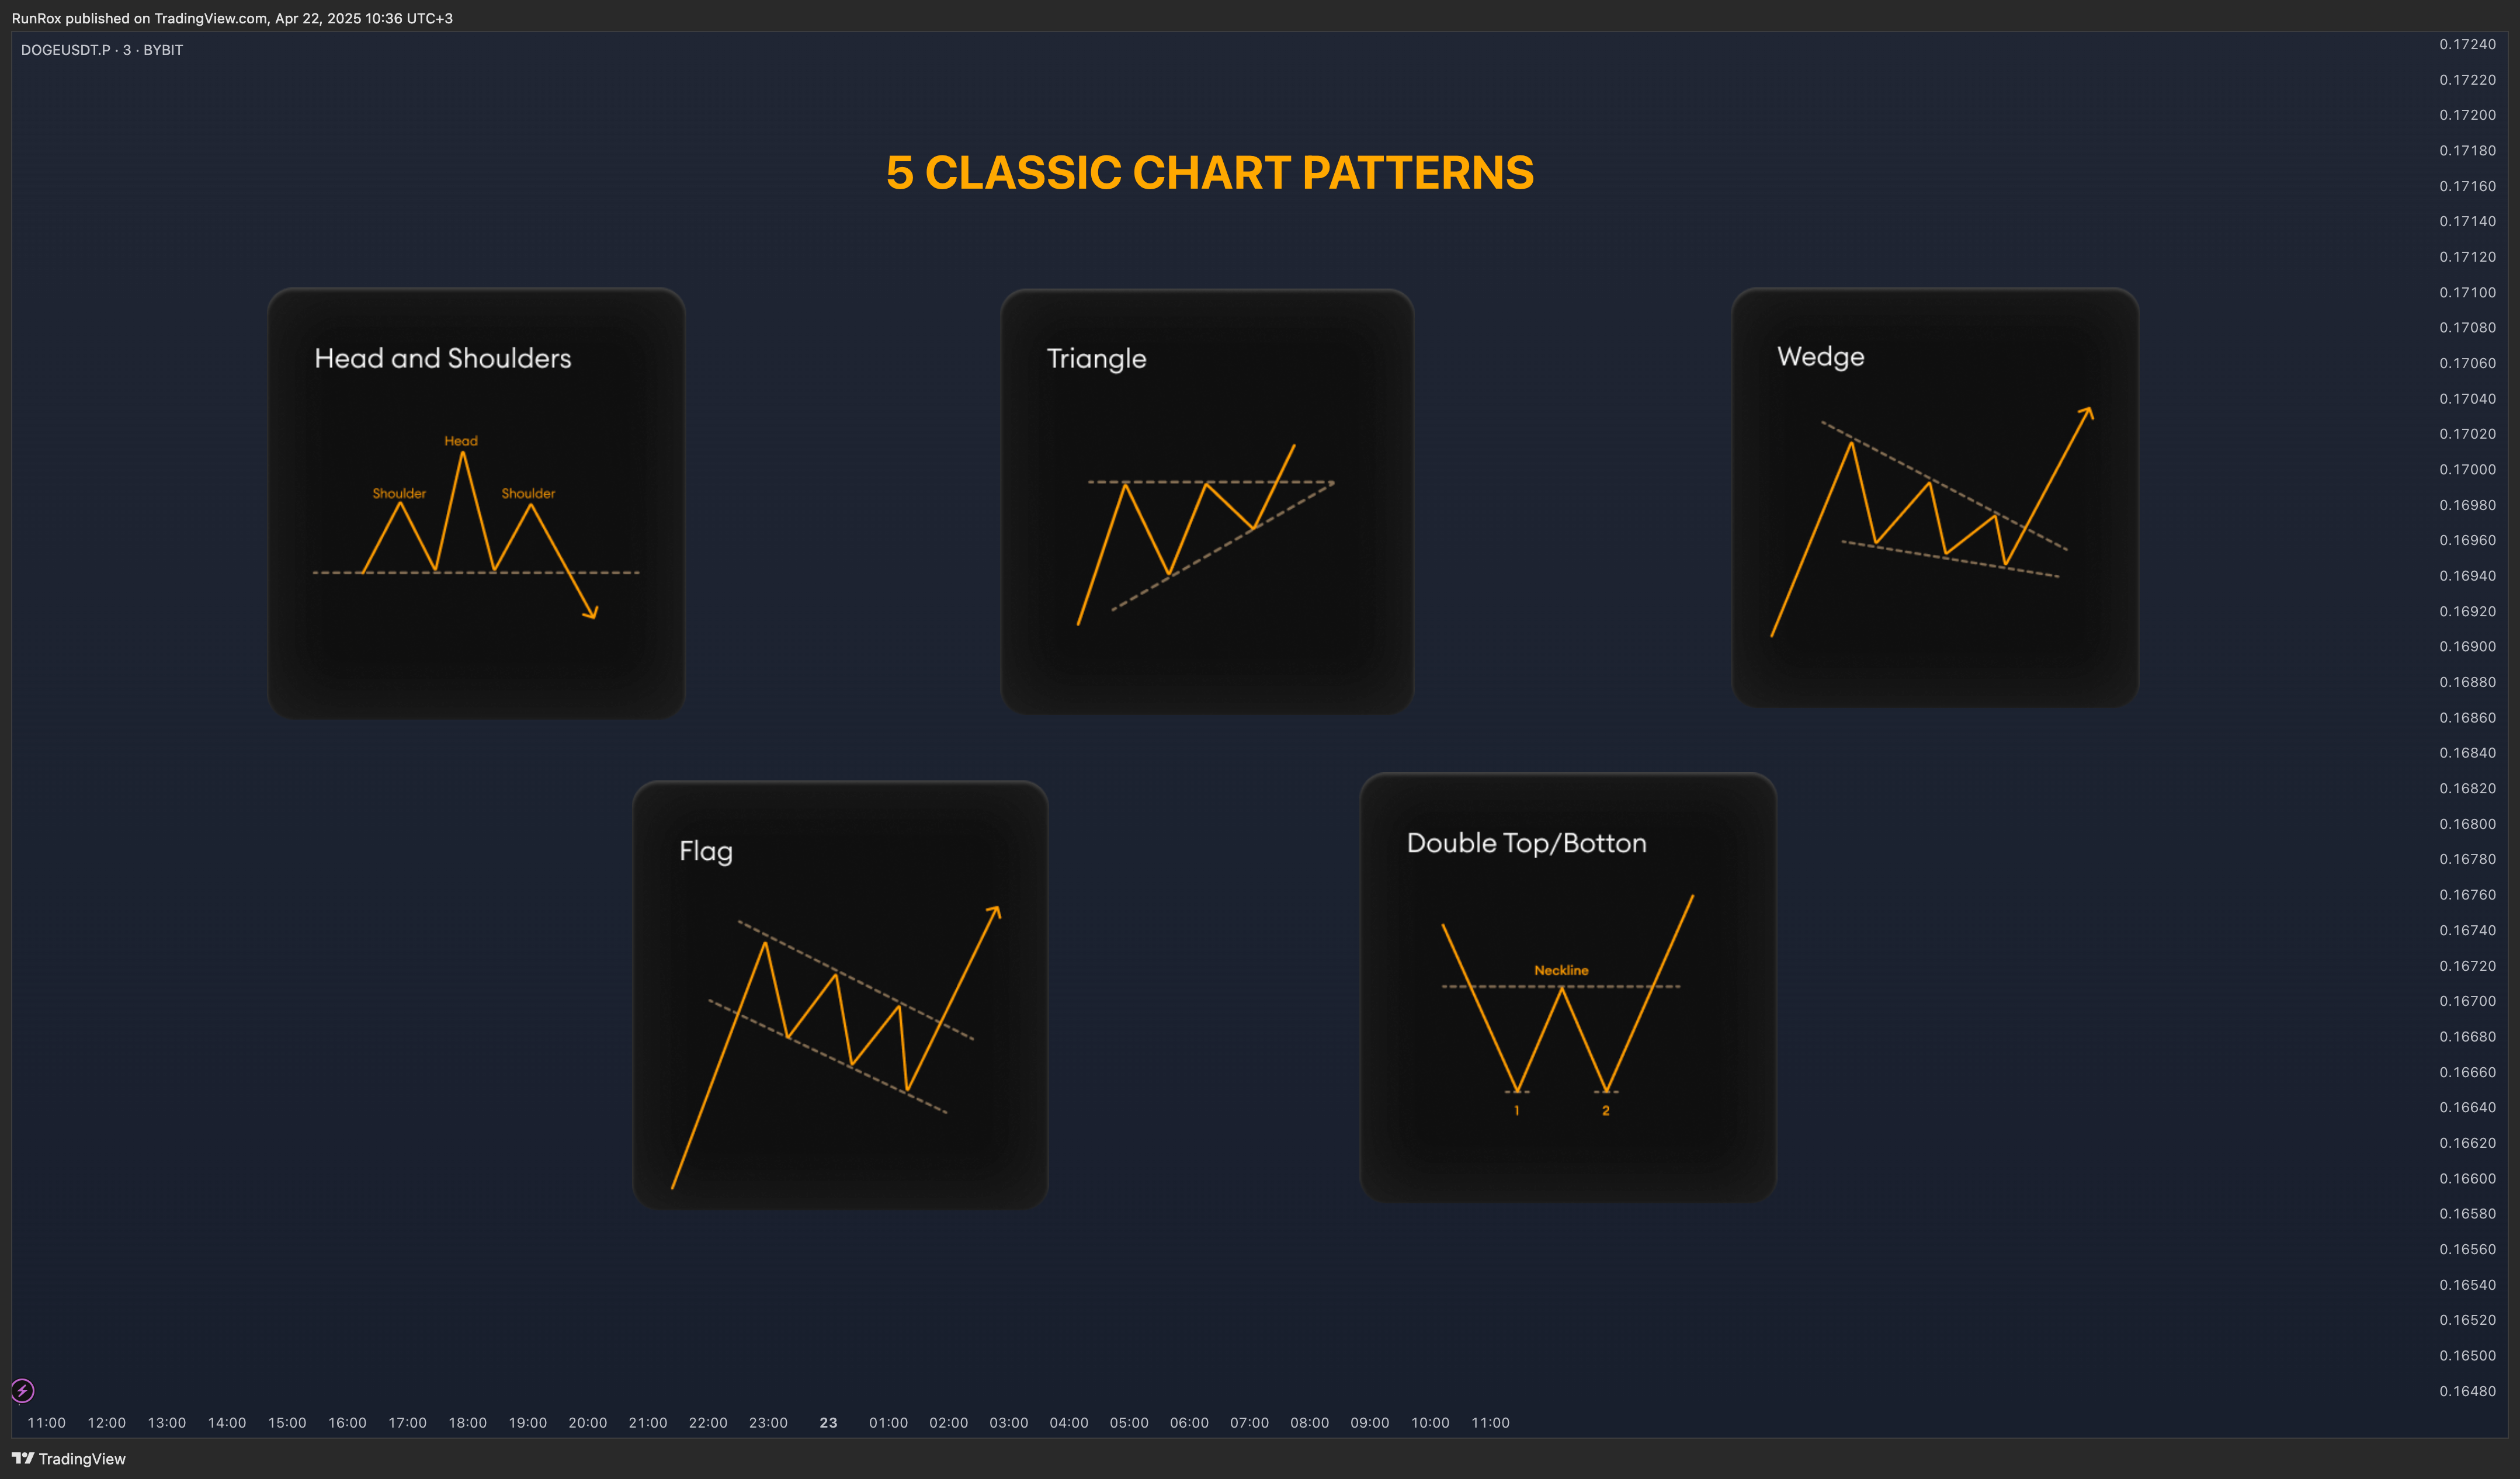
  • ✅ 5 Classic Chart Patterns:
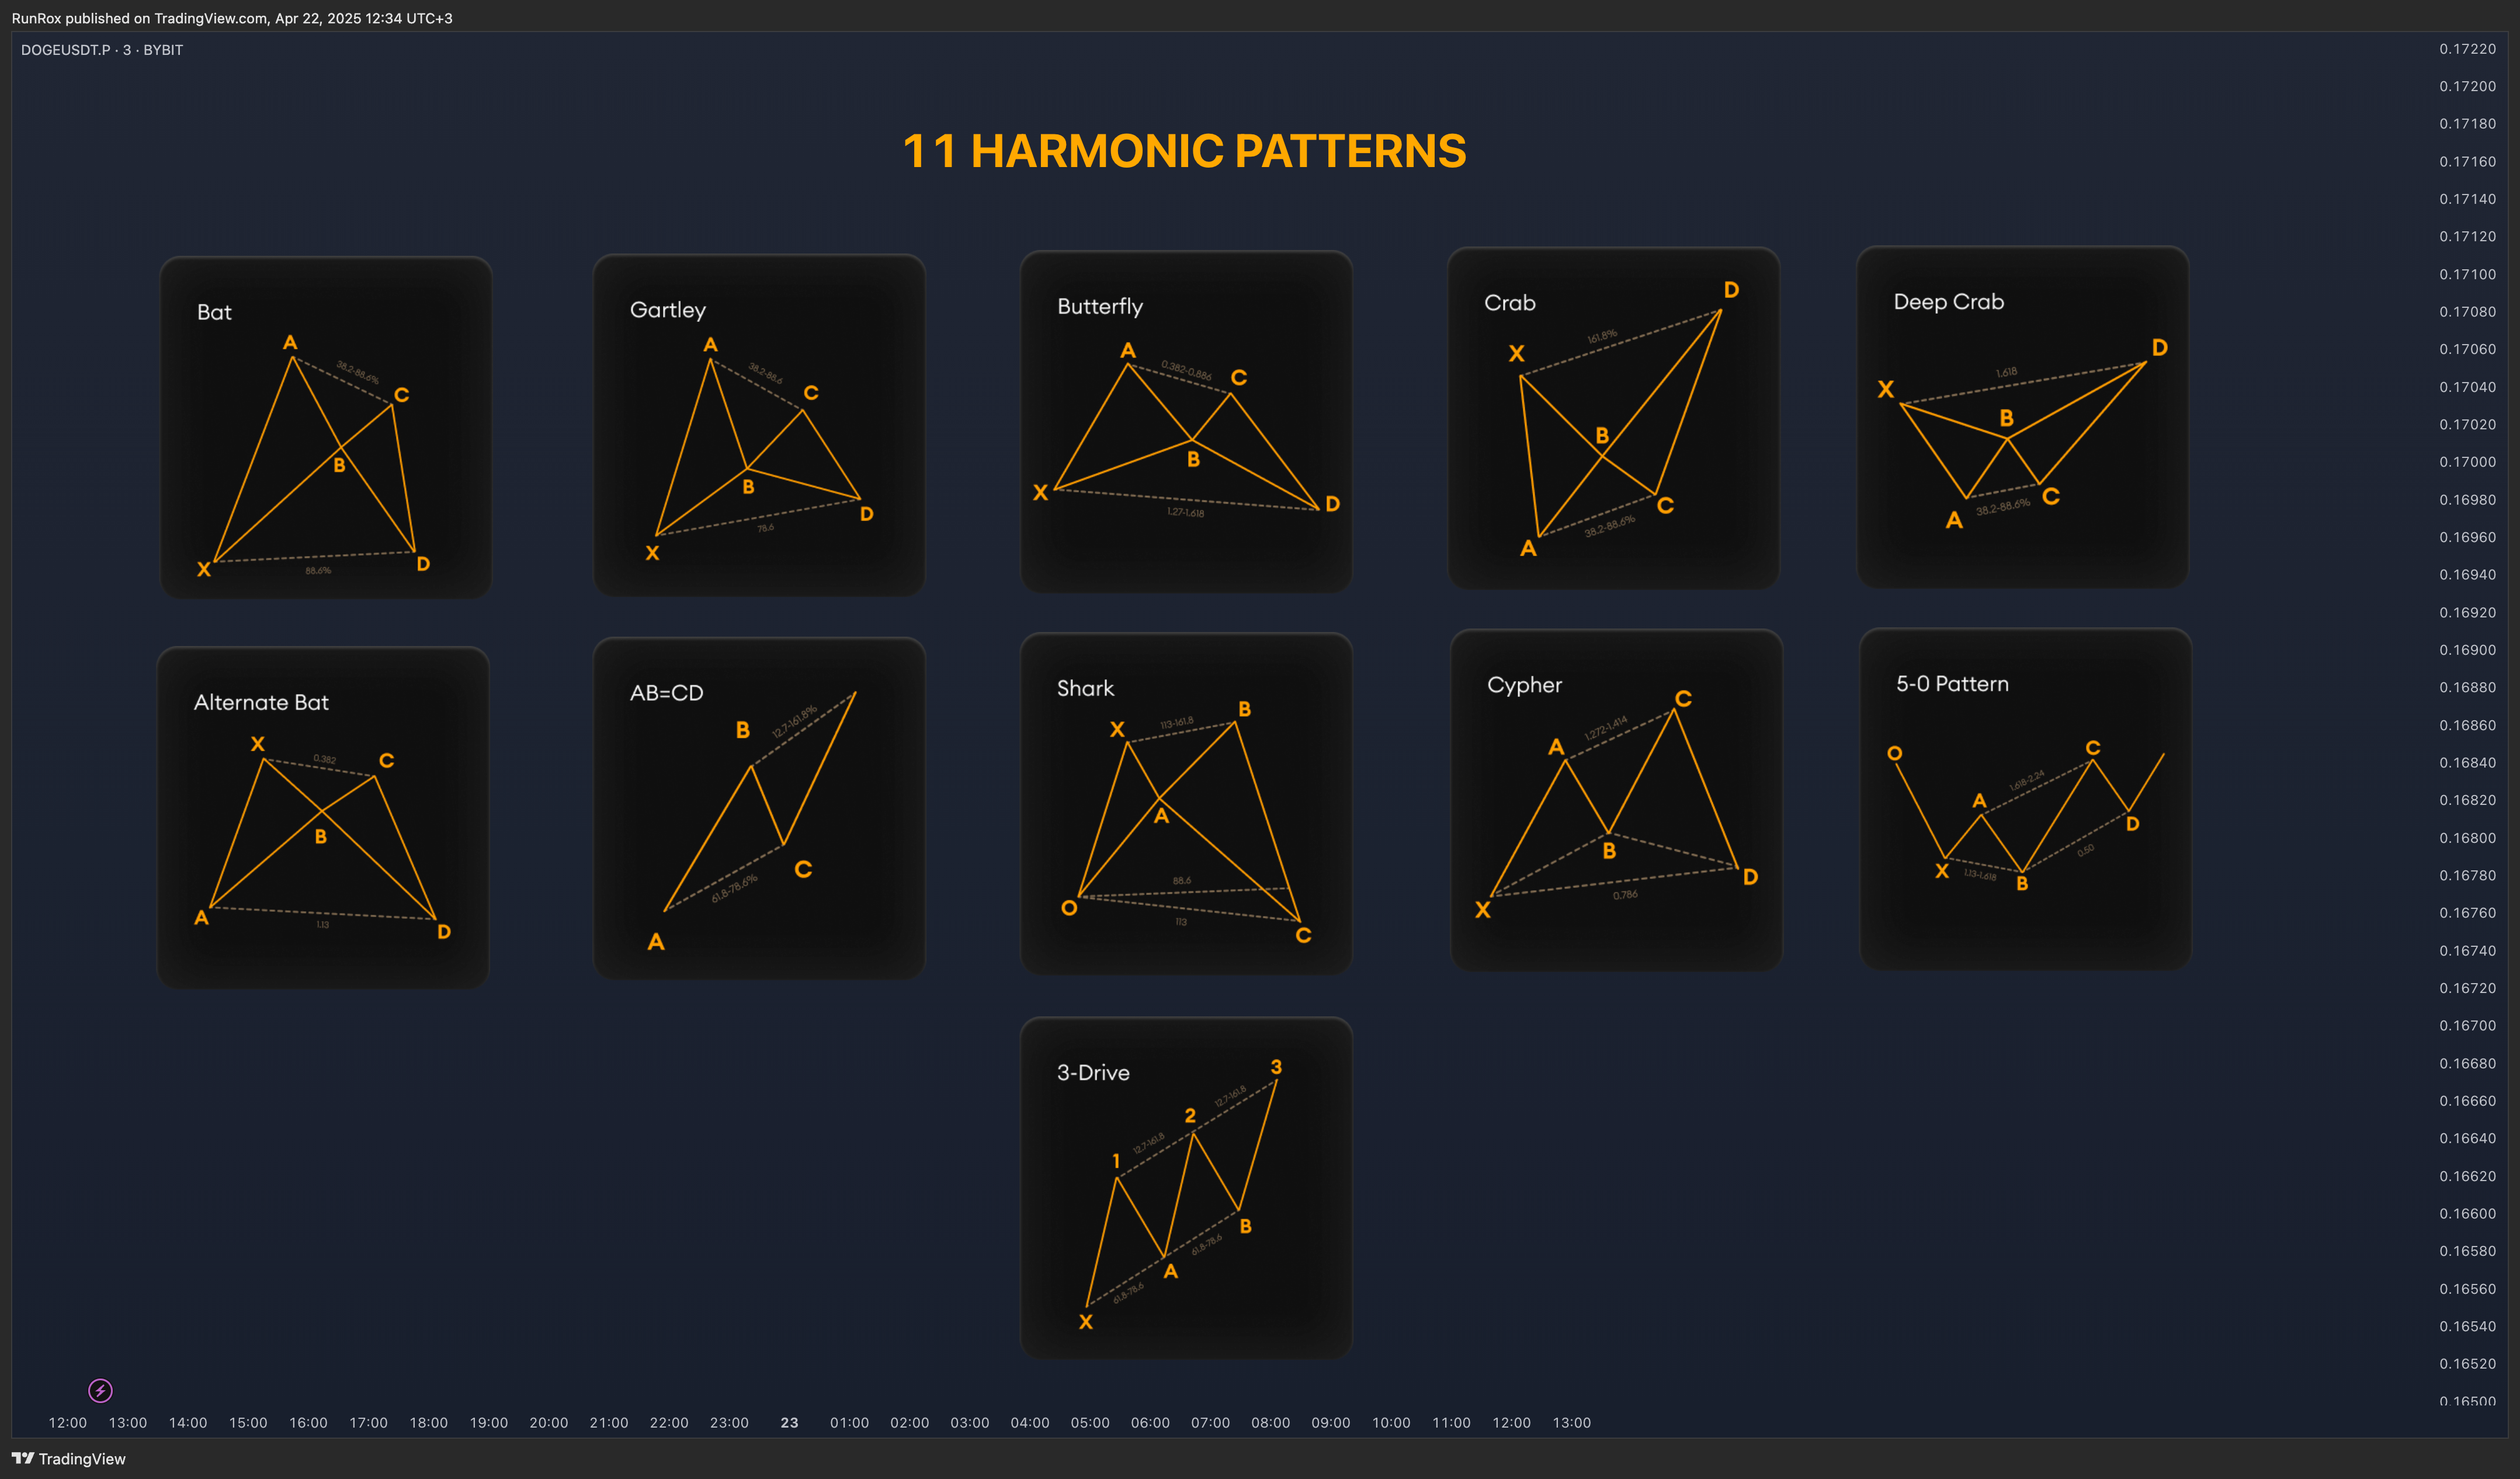
    Head and Shoulders, Triangle, Wedge, Flag, Double Top/Bottom
  • ✅ 11 Harmonic Patterns:
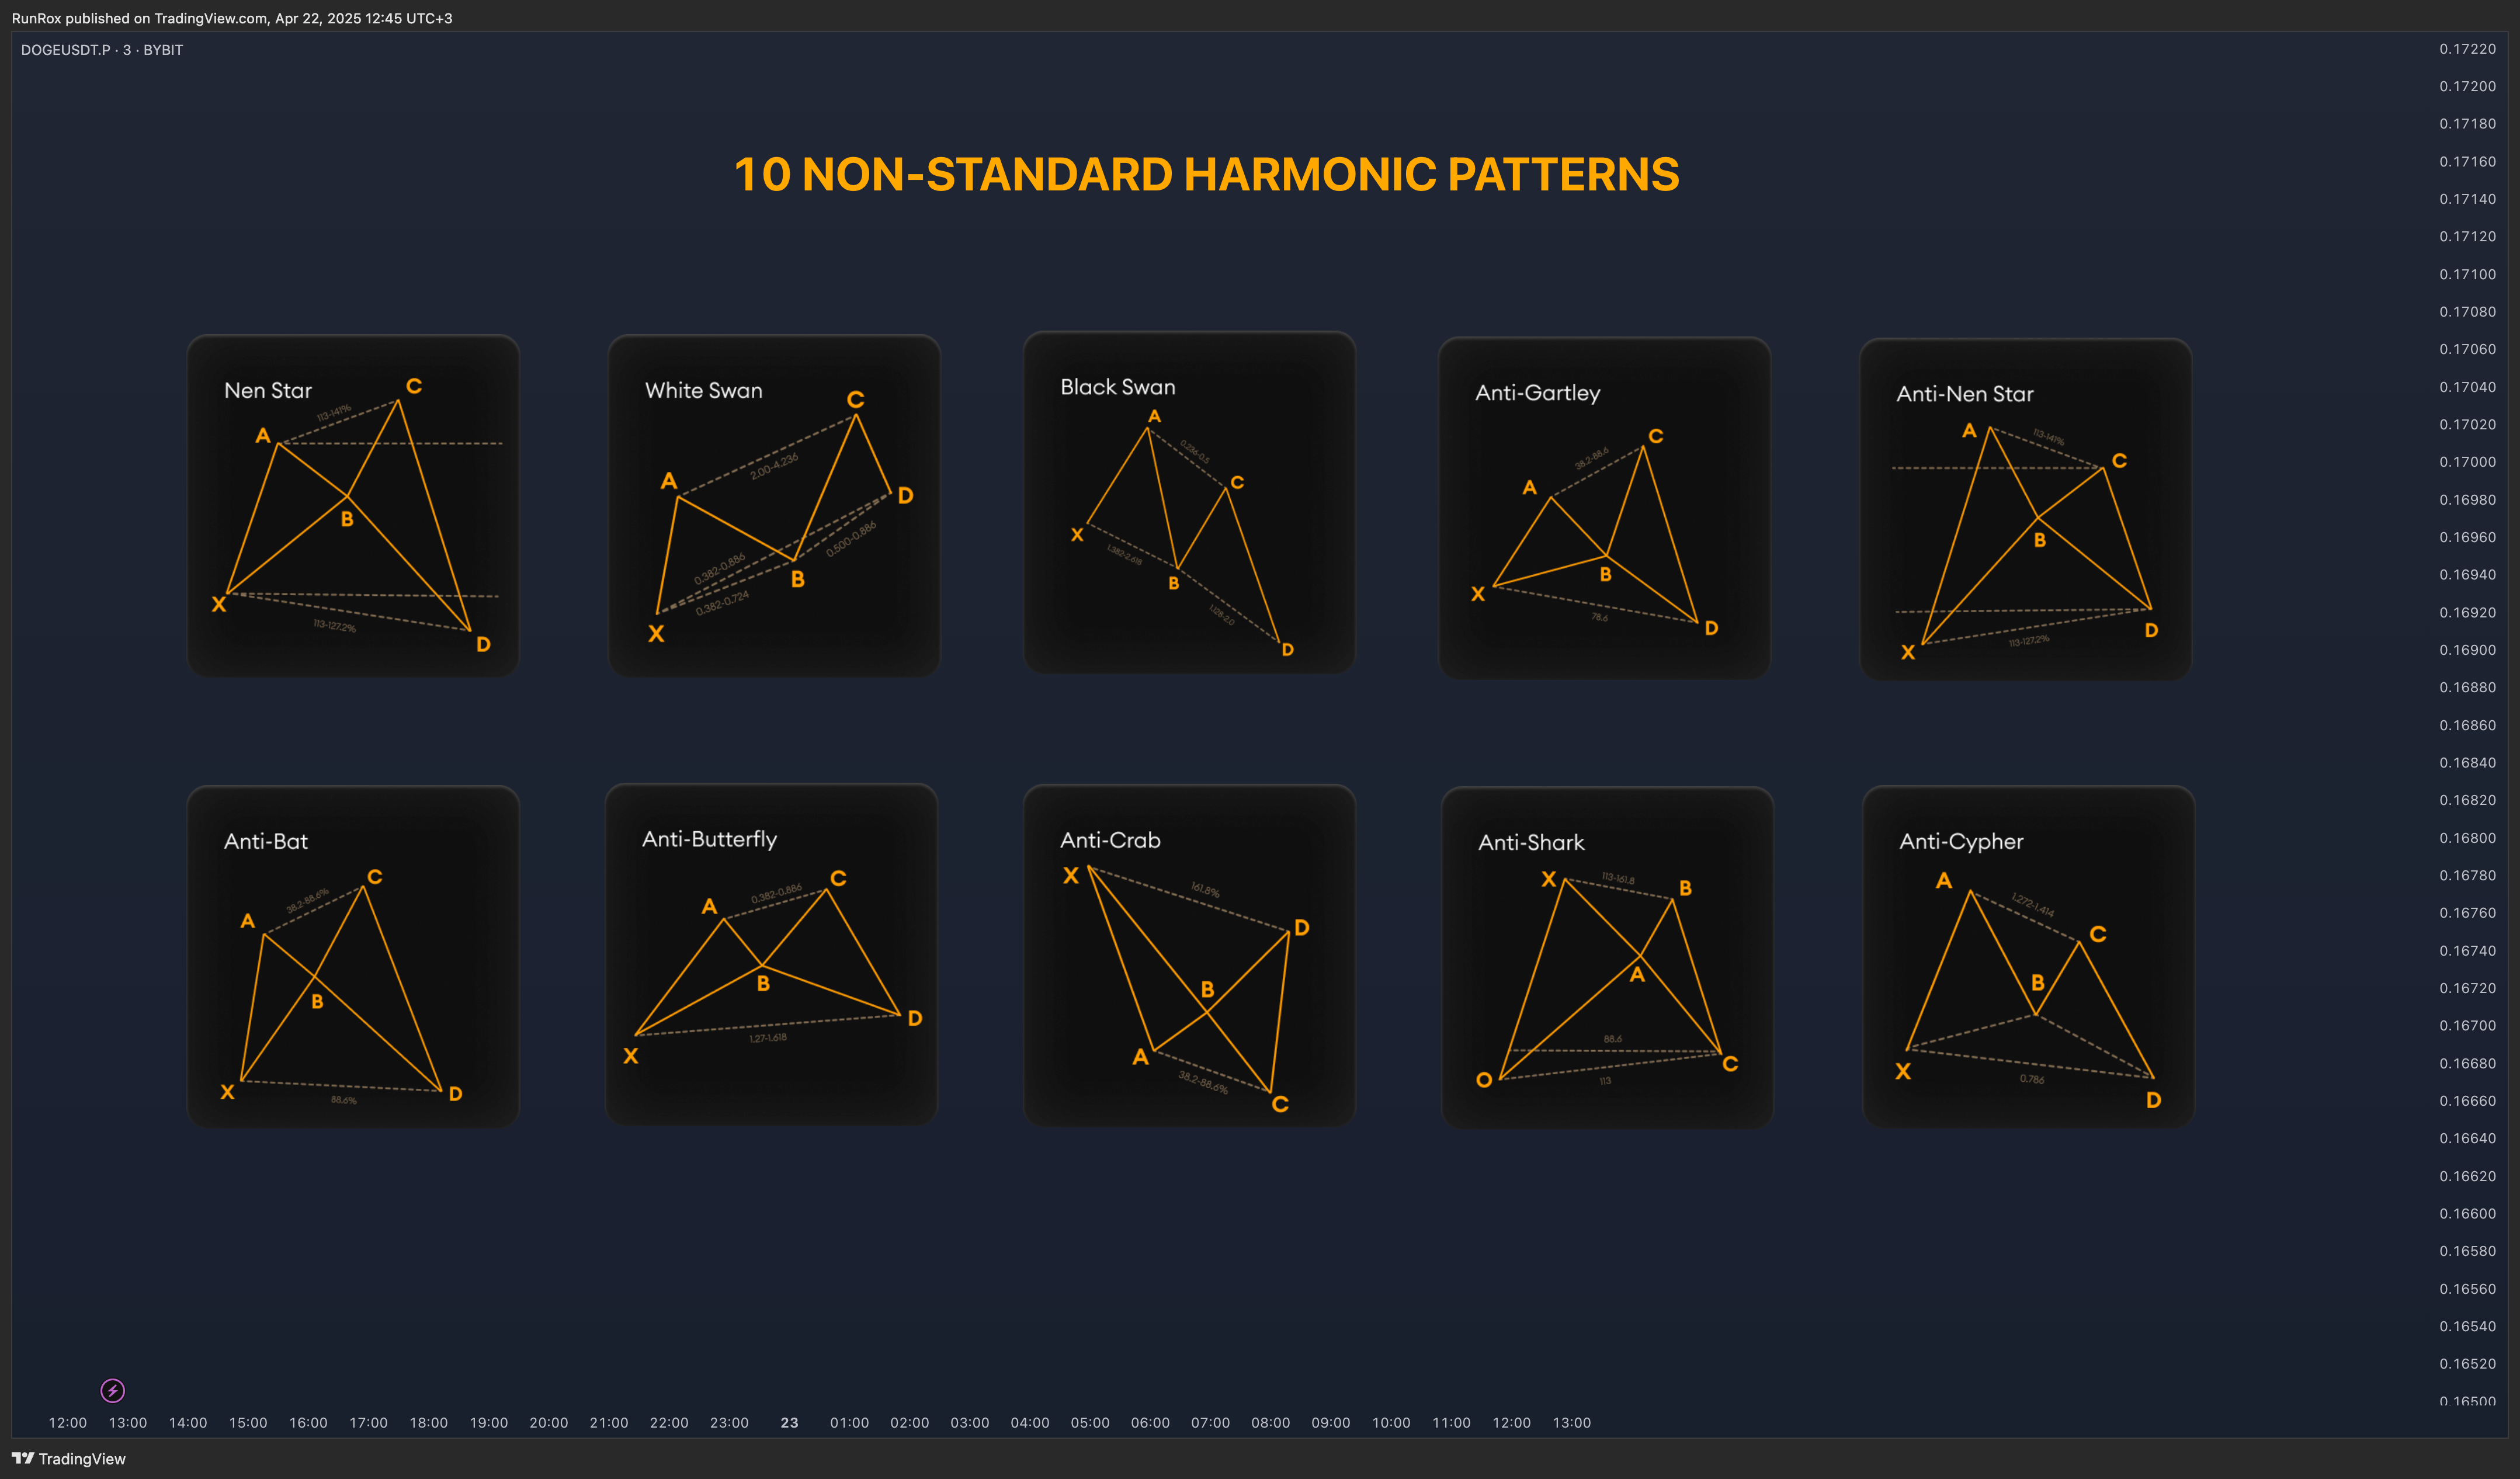
    Bat, Alternate Bat, Butterfly, Crab, Deep Crab, Gartley, Shark, Cypher, 5-0 Pattern, AB=CD, 3-Drive
  • ✅ 10 Non-standard Harmonic Patterns:
    Nen Star, White Swan, Black Swan, Anti-Bat, Anti-Butterfly, Anti-Crab, Anti-Gartley, Anti-Shark, Anti-Cypher, Anti-Nen Star

Additional features:

  • Built-in backtesting system
  • Pattern win-rate calculation
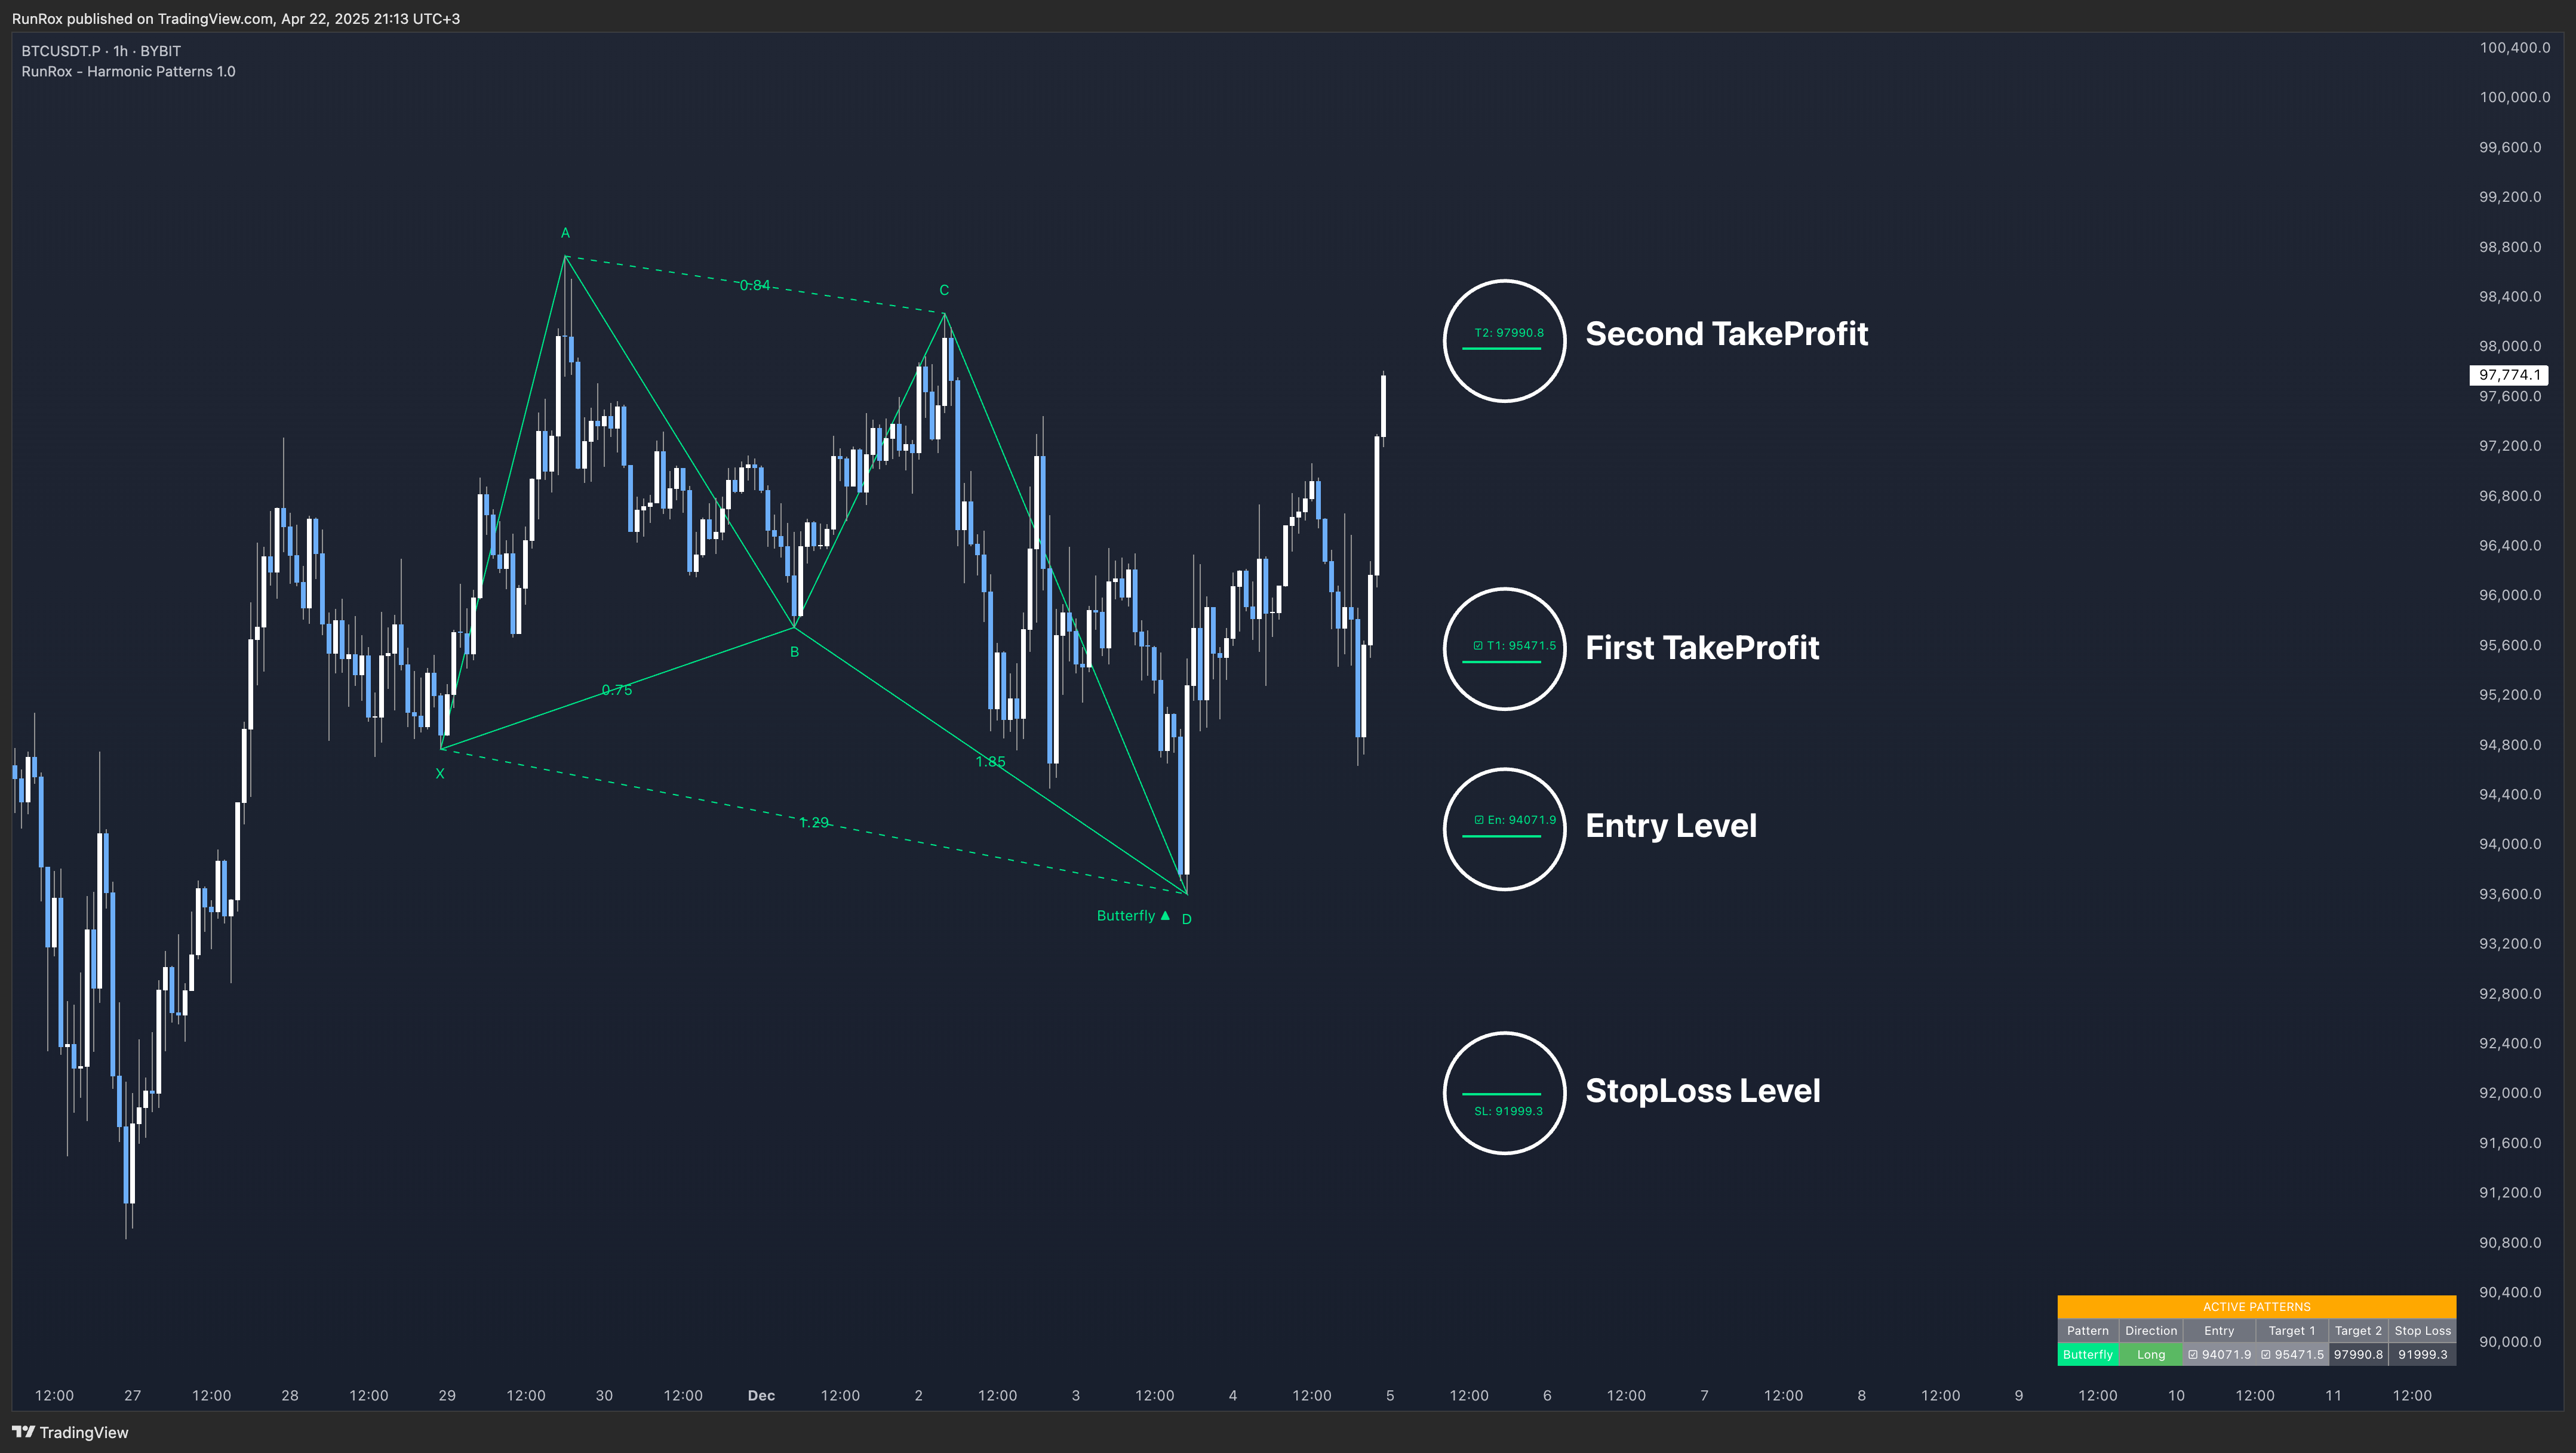
  • Flexible Stop Loss settings
  • Flexible Take Profit settings
  • Customizable pattern detection parameters
  • Advanced trailing stop functionality
  • Flexible notification system
  • And much more.

Below is a screenshot visually illustrating all the classic chart patterns that our indicator identifies on the chart.

This is how the 11 harmonic patterns visually appear on the chart.

10 Non-standard harmonic patterns visually represented on the chart.

XABCD are standard letters representing specific points used in forming harmonic patterns. The sequence always begins with the point X as the initial reference point, followed by points ABCD, which together complete the harmonic pattern.

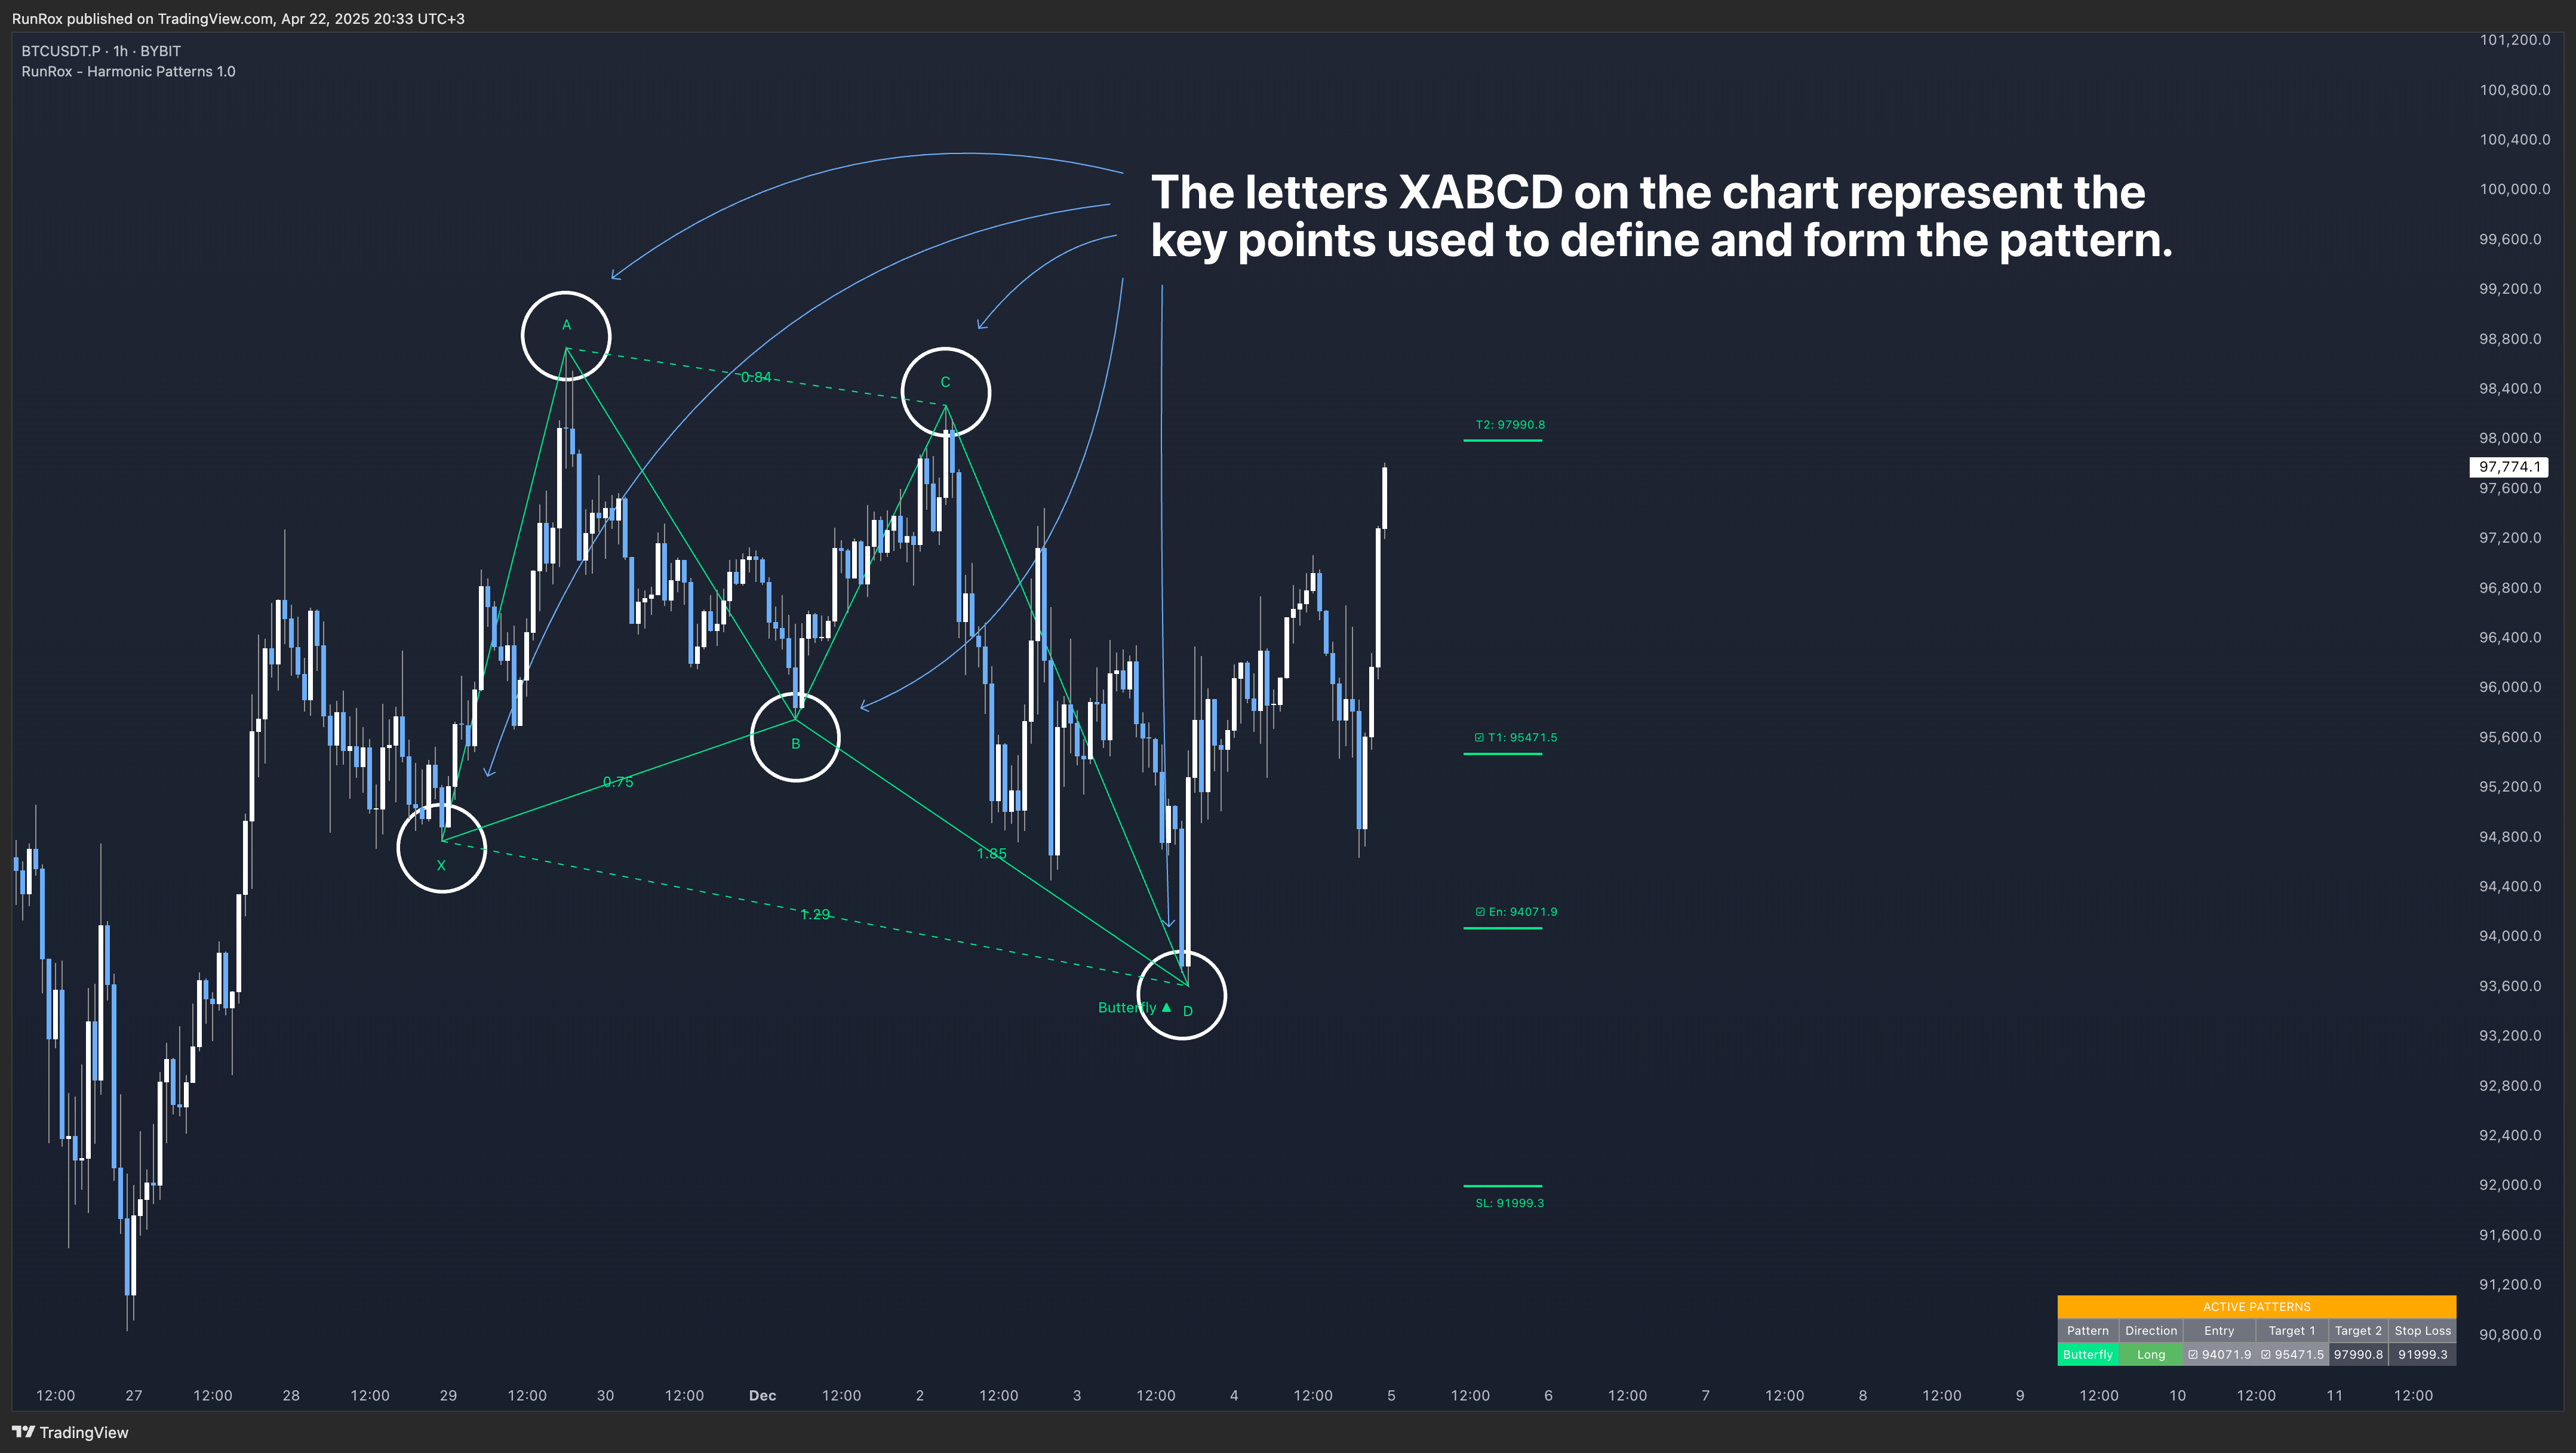
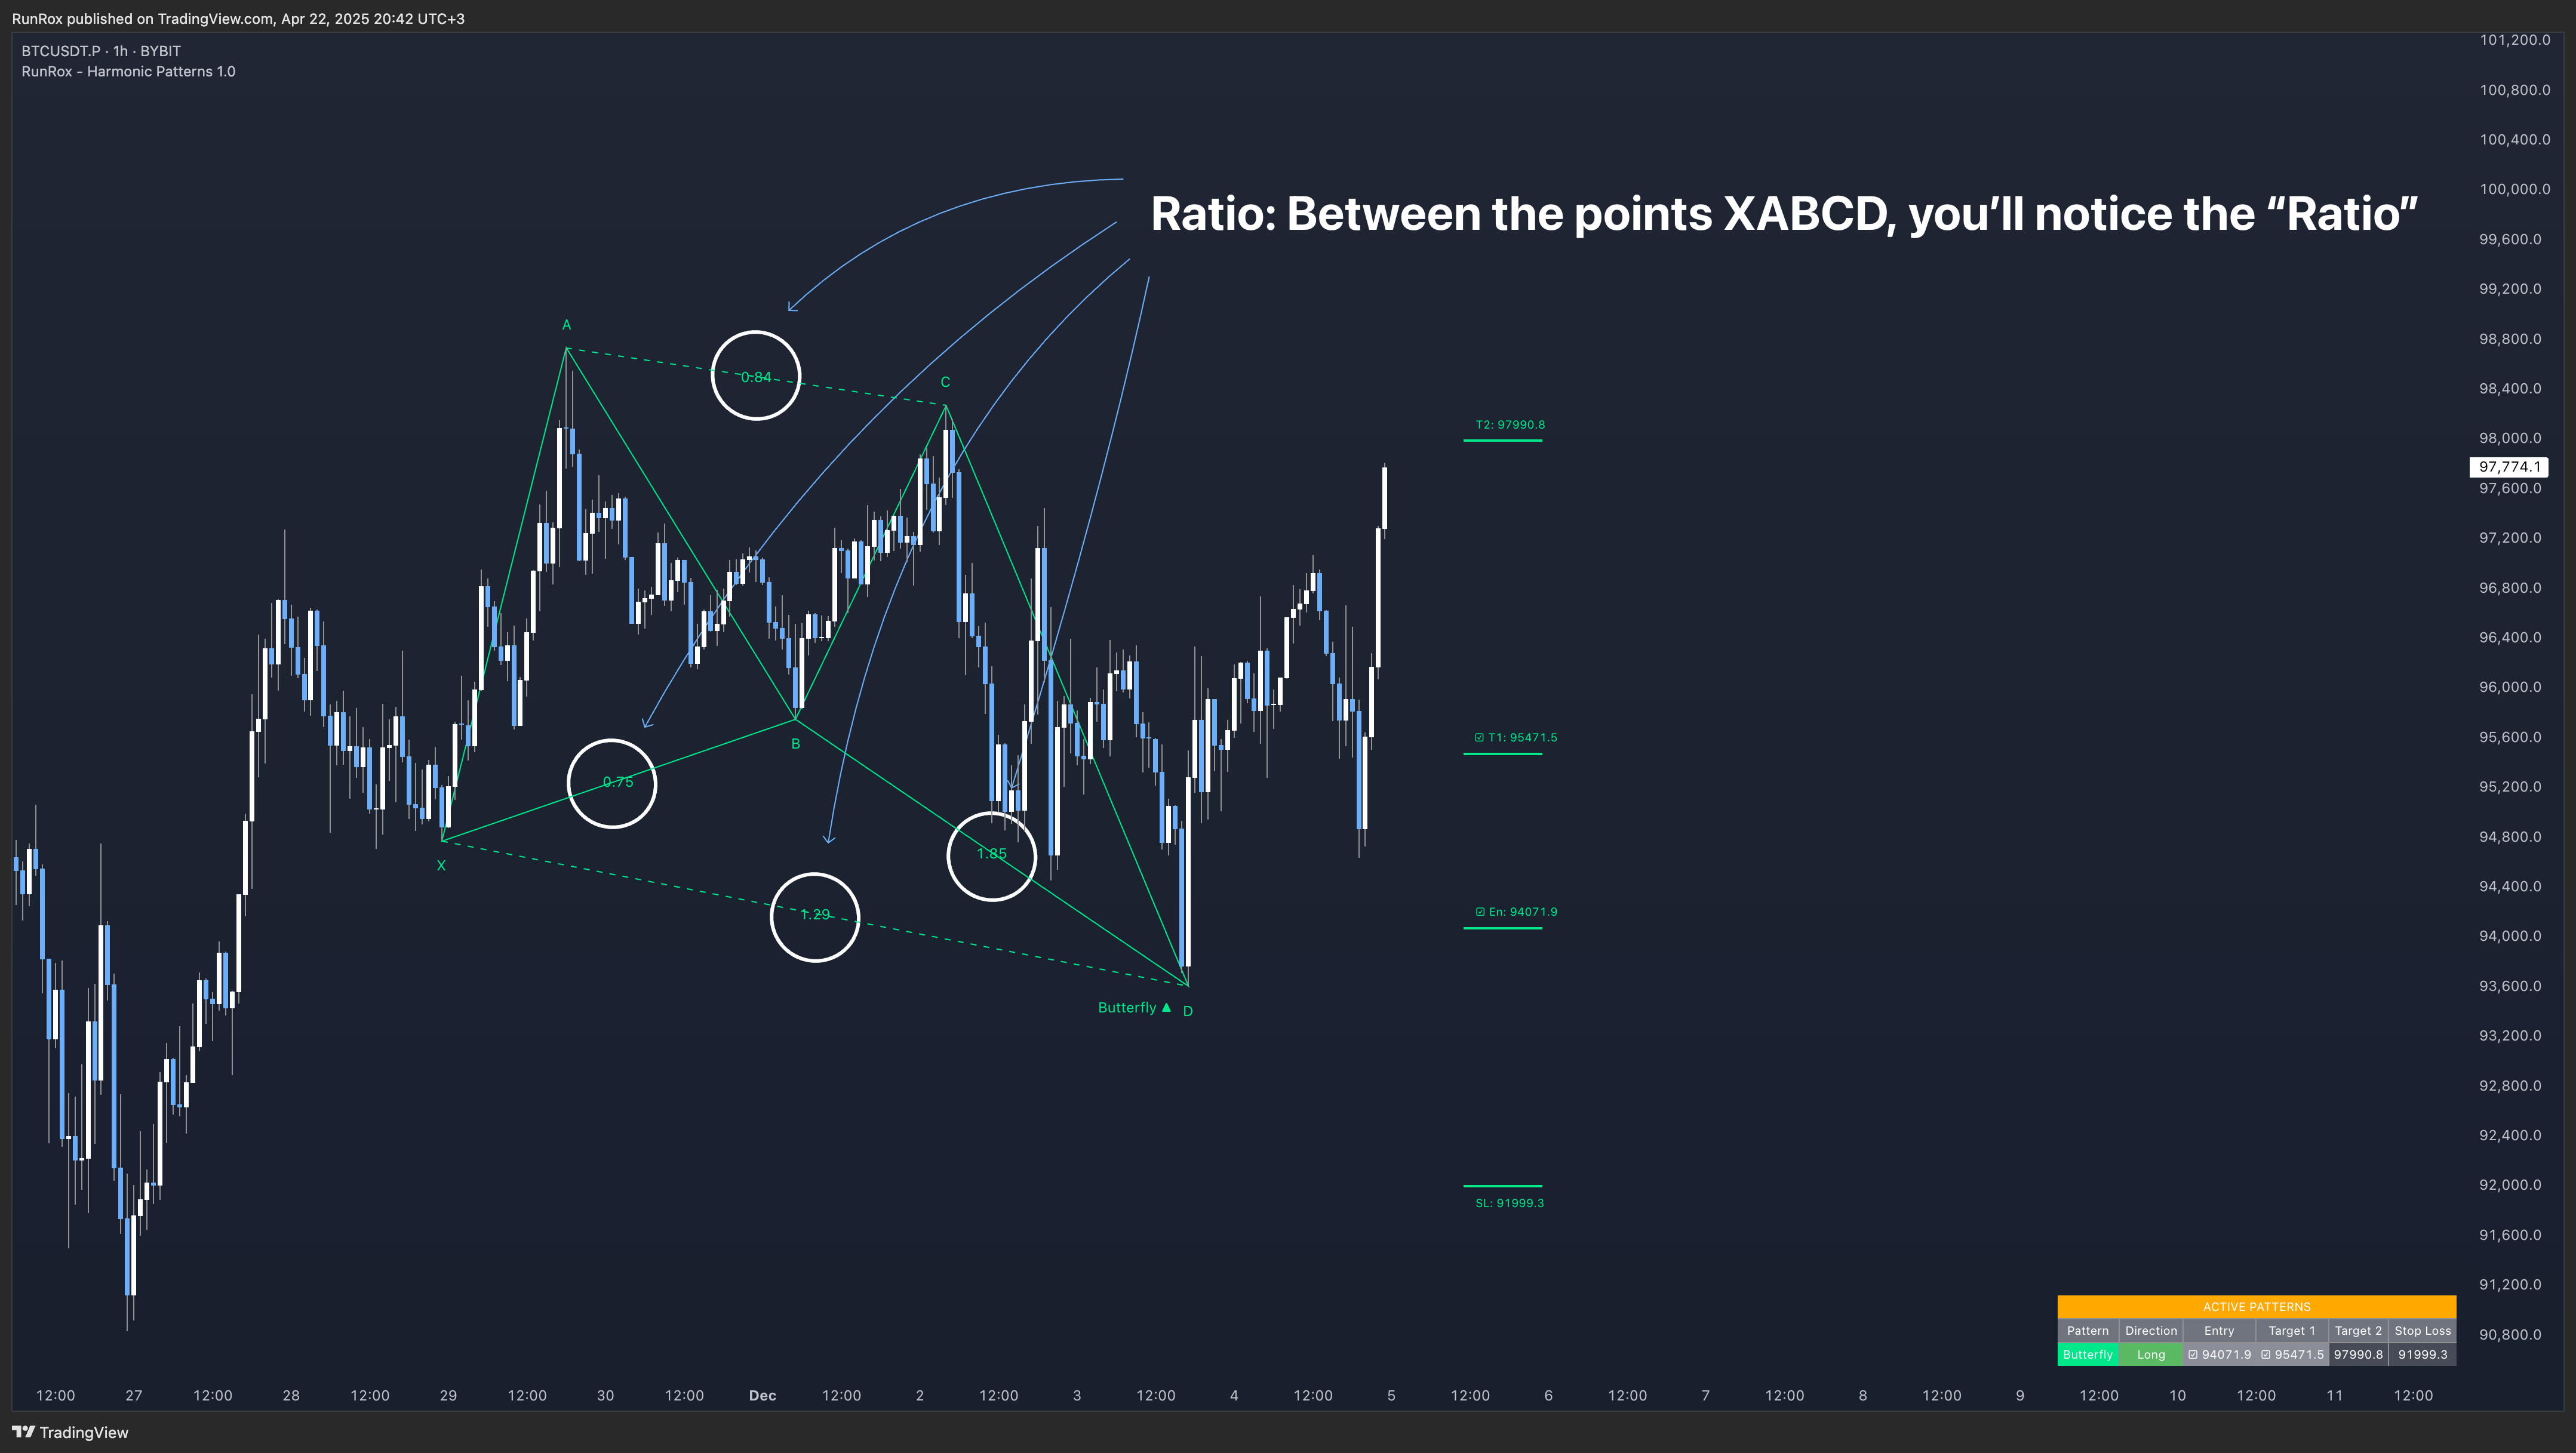
These points are identified using a specialized method, scanning through thousands of potential points on the chart simultaneously. The indicator analyzes numerous potential formations, selecting and displaying only those patterns that meet specific validation criteria. This meticulous process ensures that only valid and accurate patterns appear on your chart, as illustrated in the screenshot below.

Ratio: Between the points XABCD, you’ll notice the “Ratio,” indicating the proportional relationships required between these points to correctly form harmonic patterns. The indicator displays a pattern on the chart only when these ratio conditions are precisely met, thereby maximizing accuracy and ensuring the validity of identified patterns. This aspect is clearly demonstrated in the screenshot below.

TP and SL levels: For each identified pattern, we also display recommended Take Profit (TP) and Stop Loss (SL) levels directly on the chart. Additionally, we provide a suggested entry price (Entry Level). It is important to note that entering a trade requires the price to retrace into the specified Entry Level zone. Therefore, you must wait until the price returns to this zone for the pattern to be considered fully formed and ready for entry.

Using the Butterfly pattern as an example, we’ve illustrated all the key components of a pattern. Our indicator offers extensive customization, allowing you to finely adjust everything from the acceptable Ratio ranges to Stop Loss and Take Profit levels, among many other parameters. Below, we’ll discuss the indicator’s capabilities and its customizable settings in detail.

ACTIVE PATTERNS PANEL

In the screenshot above, you can see the panel displaying all active patterns currently formed on the chart, including the pattern direction, entry price, two take profit levels, and the stop loss level. This provides a quick and clear overview of the available patterns on your chart, significantly speeding up your trading process.

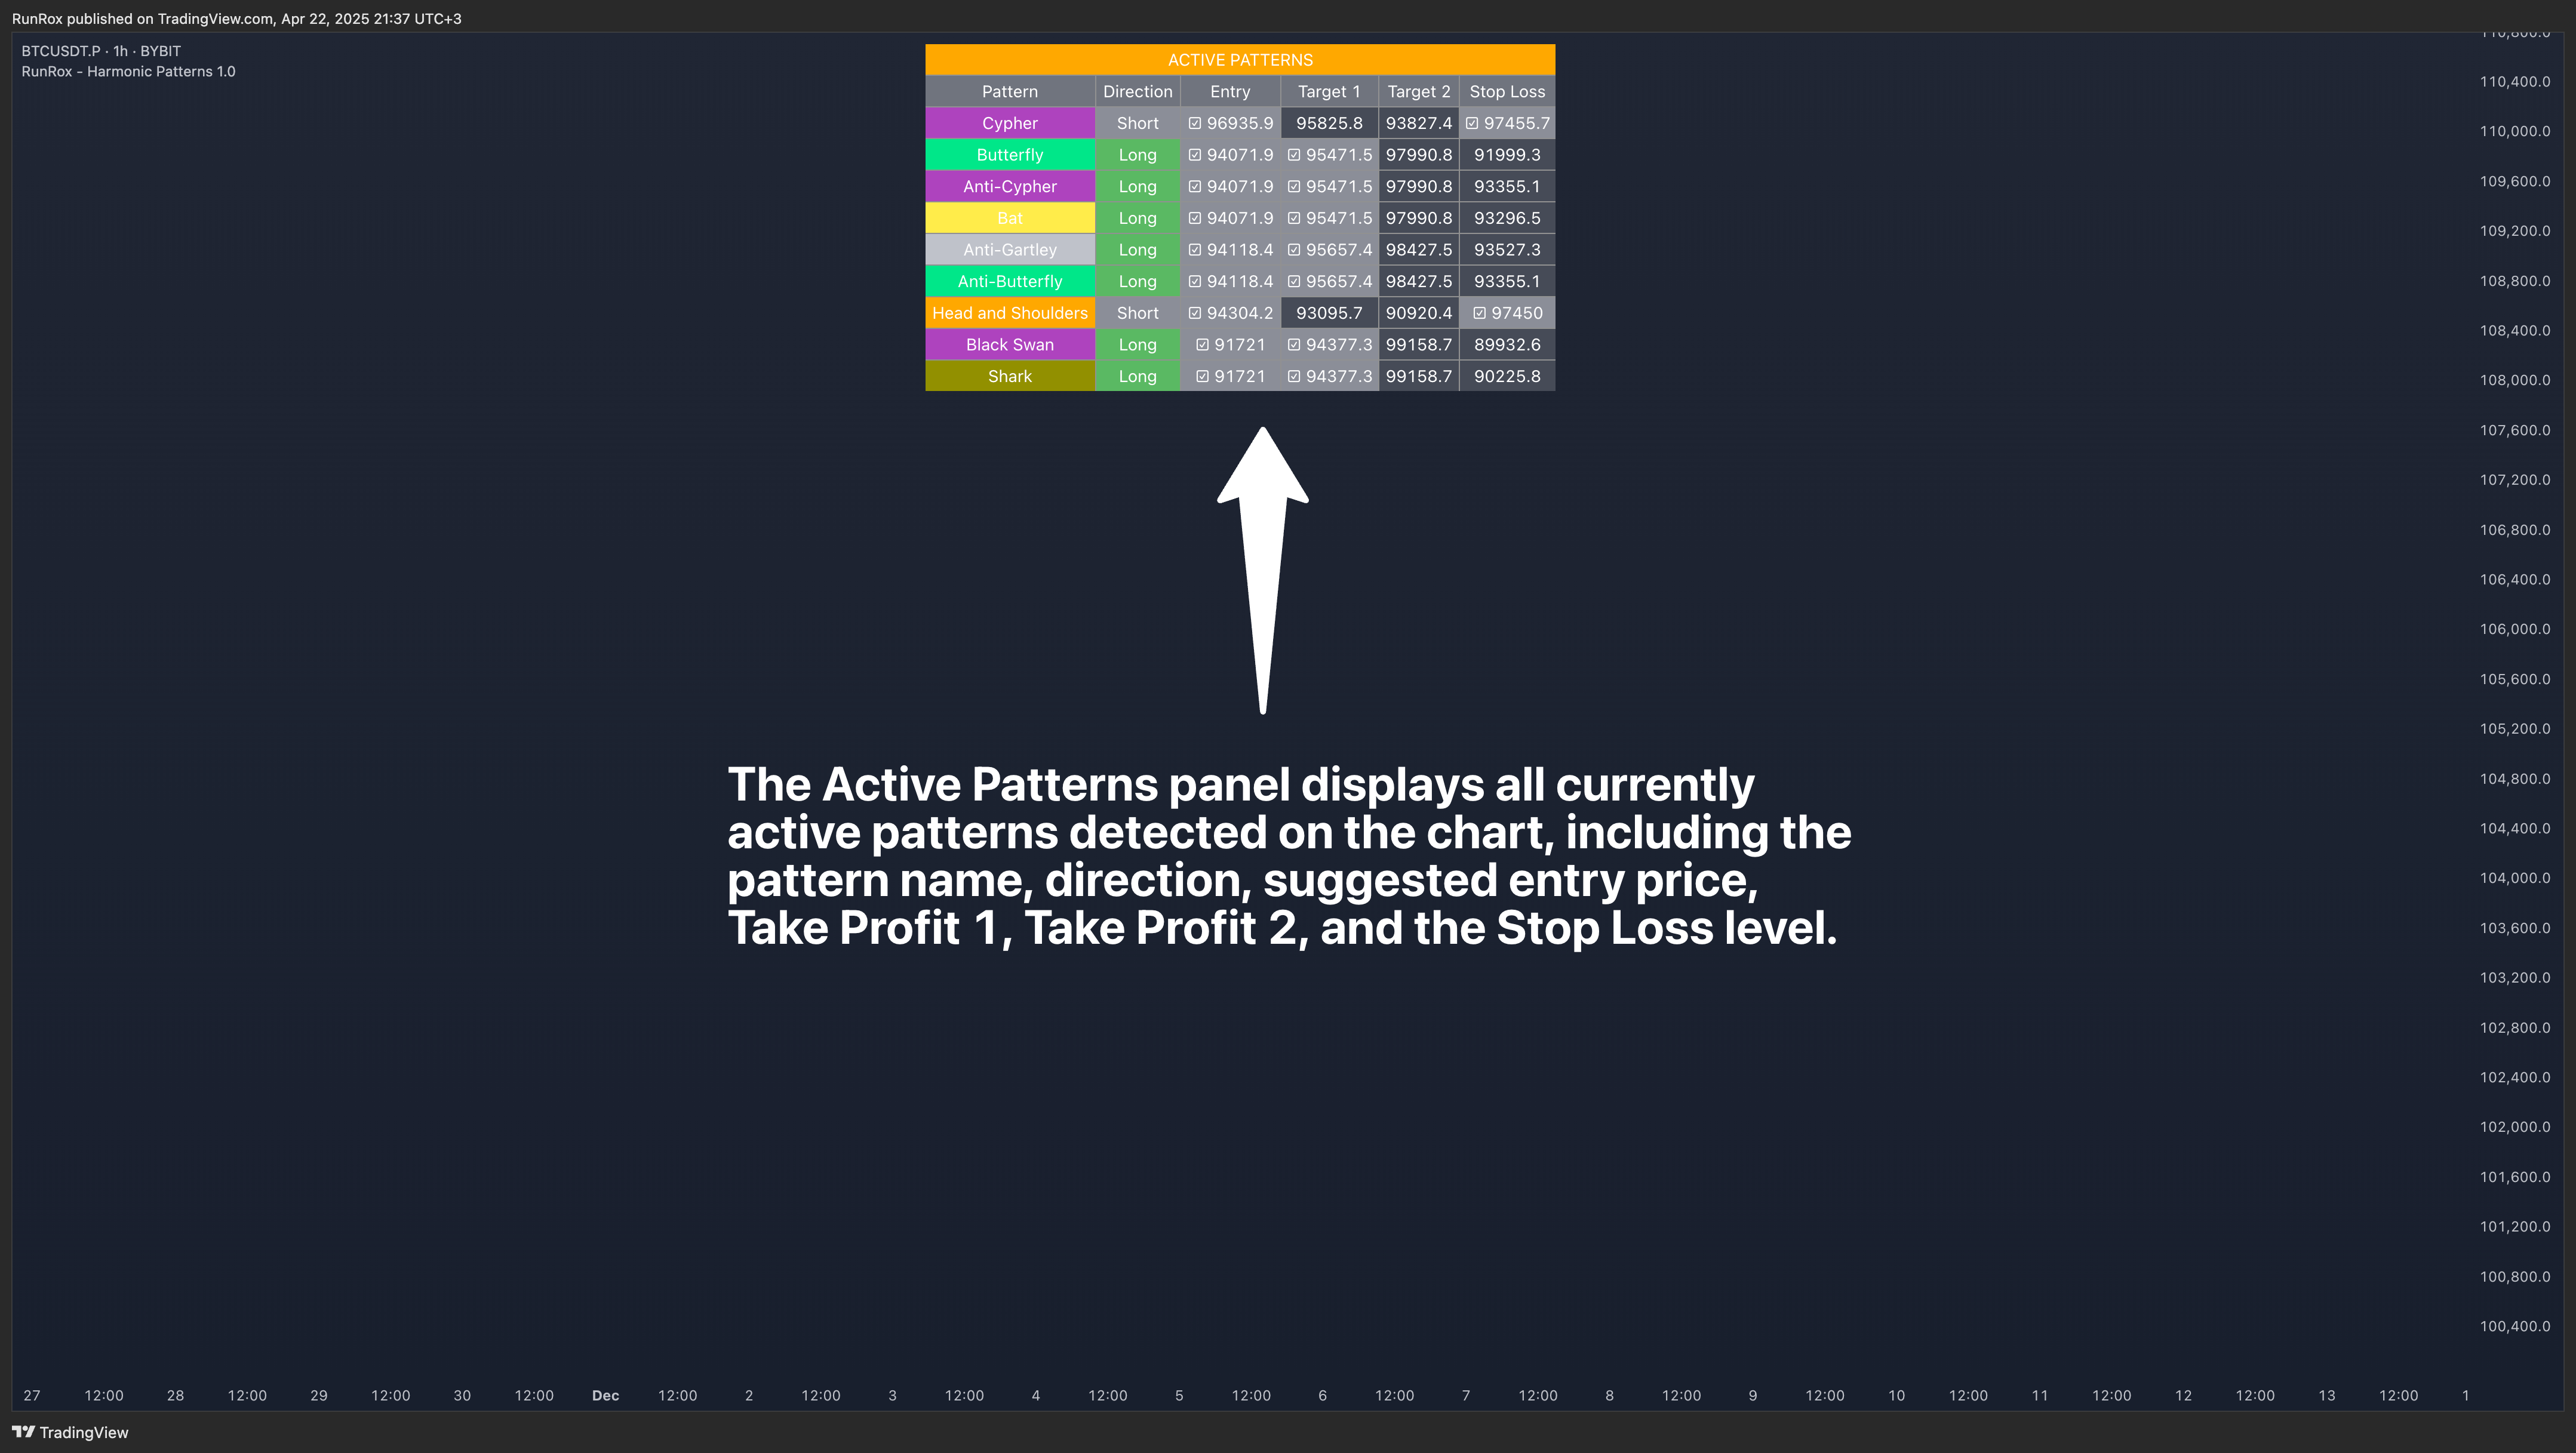
Additionally, you can fully customize this panel, adjusting its position, size, or even completely removing it if you prefer.

PATTERN STATISTICS

The Pattern Statistics Panel displays historical performance results for all patterns. The indicator automatically performs backtesting for each pattern based on historical data, taking into account all user-defined settings. Results are conveniently presented in this panel.

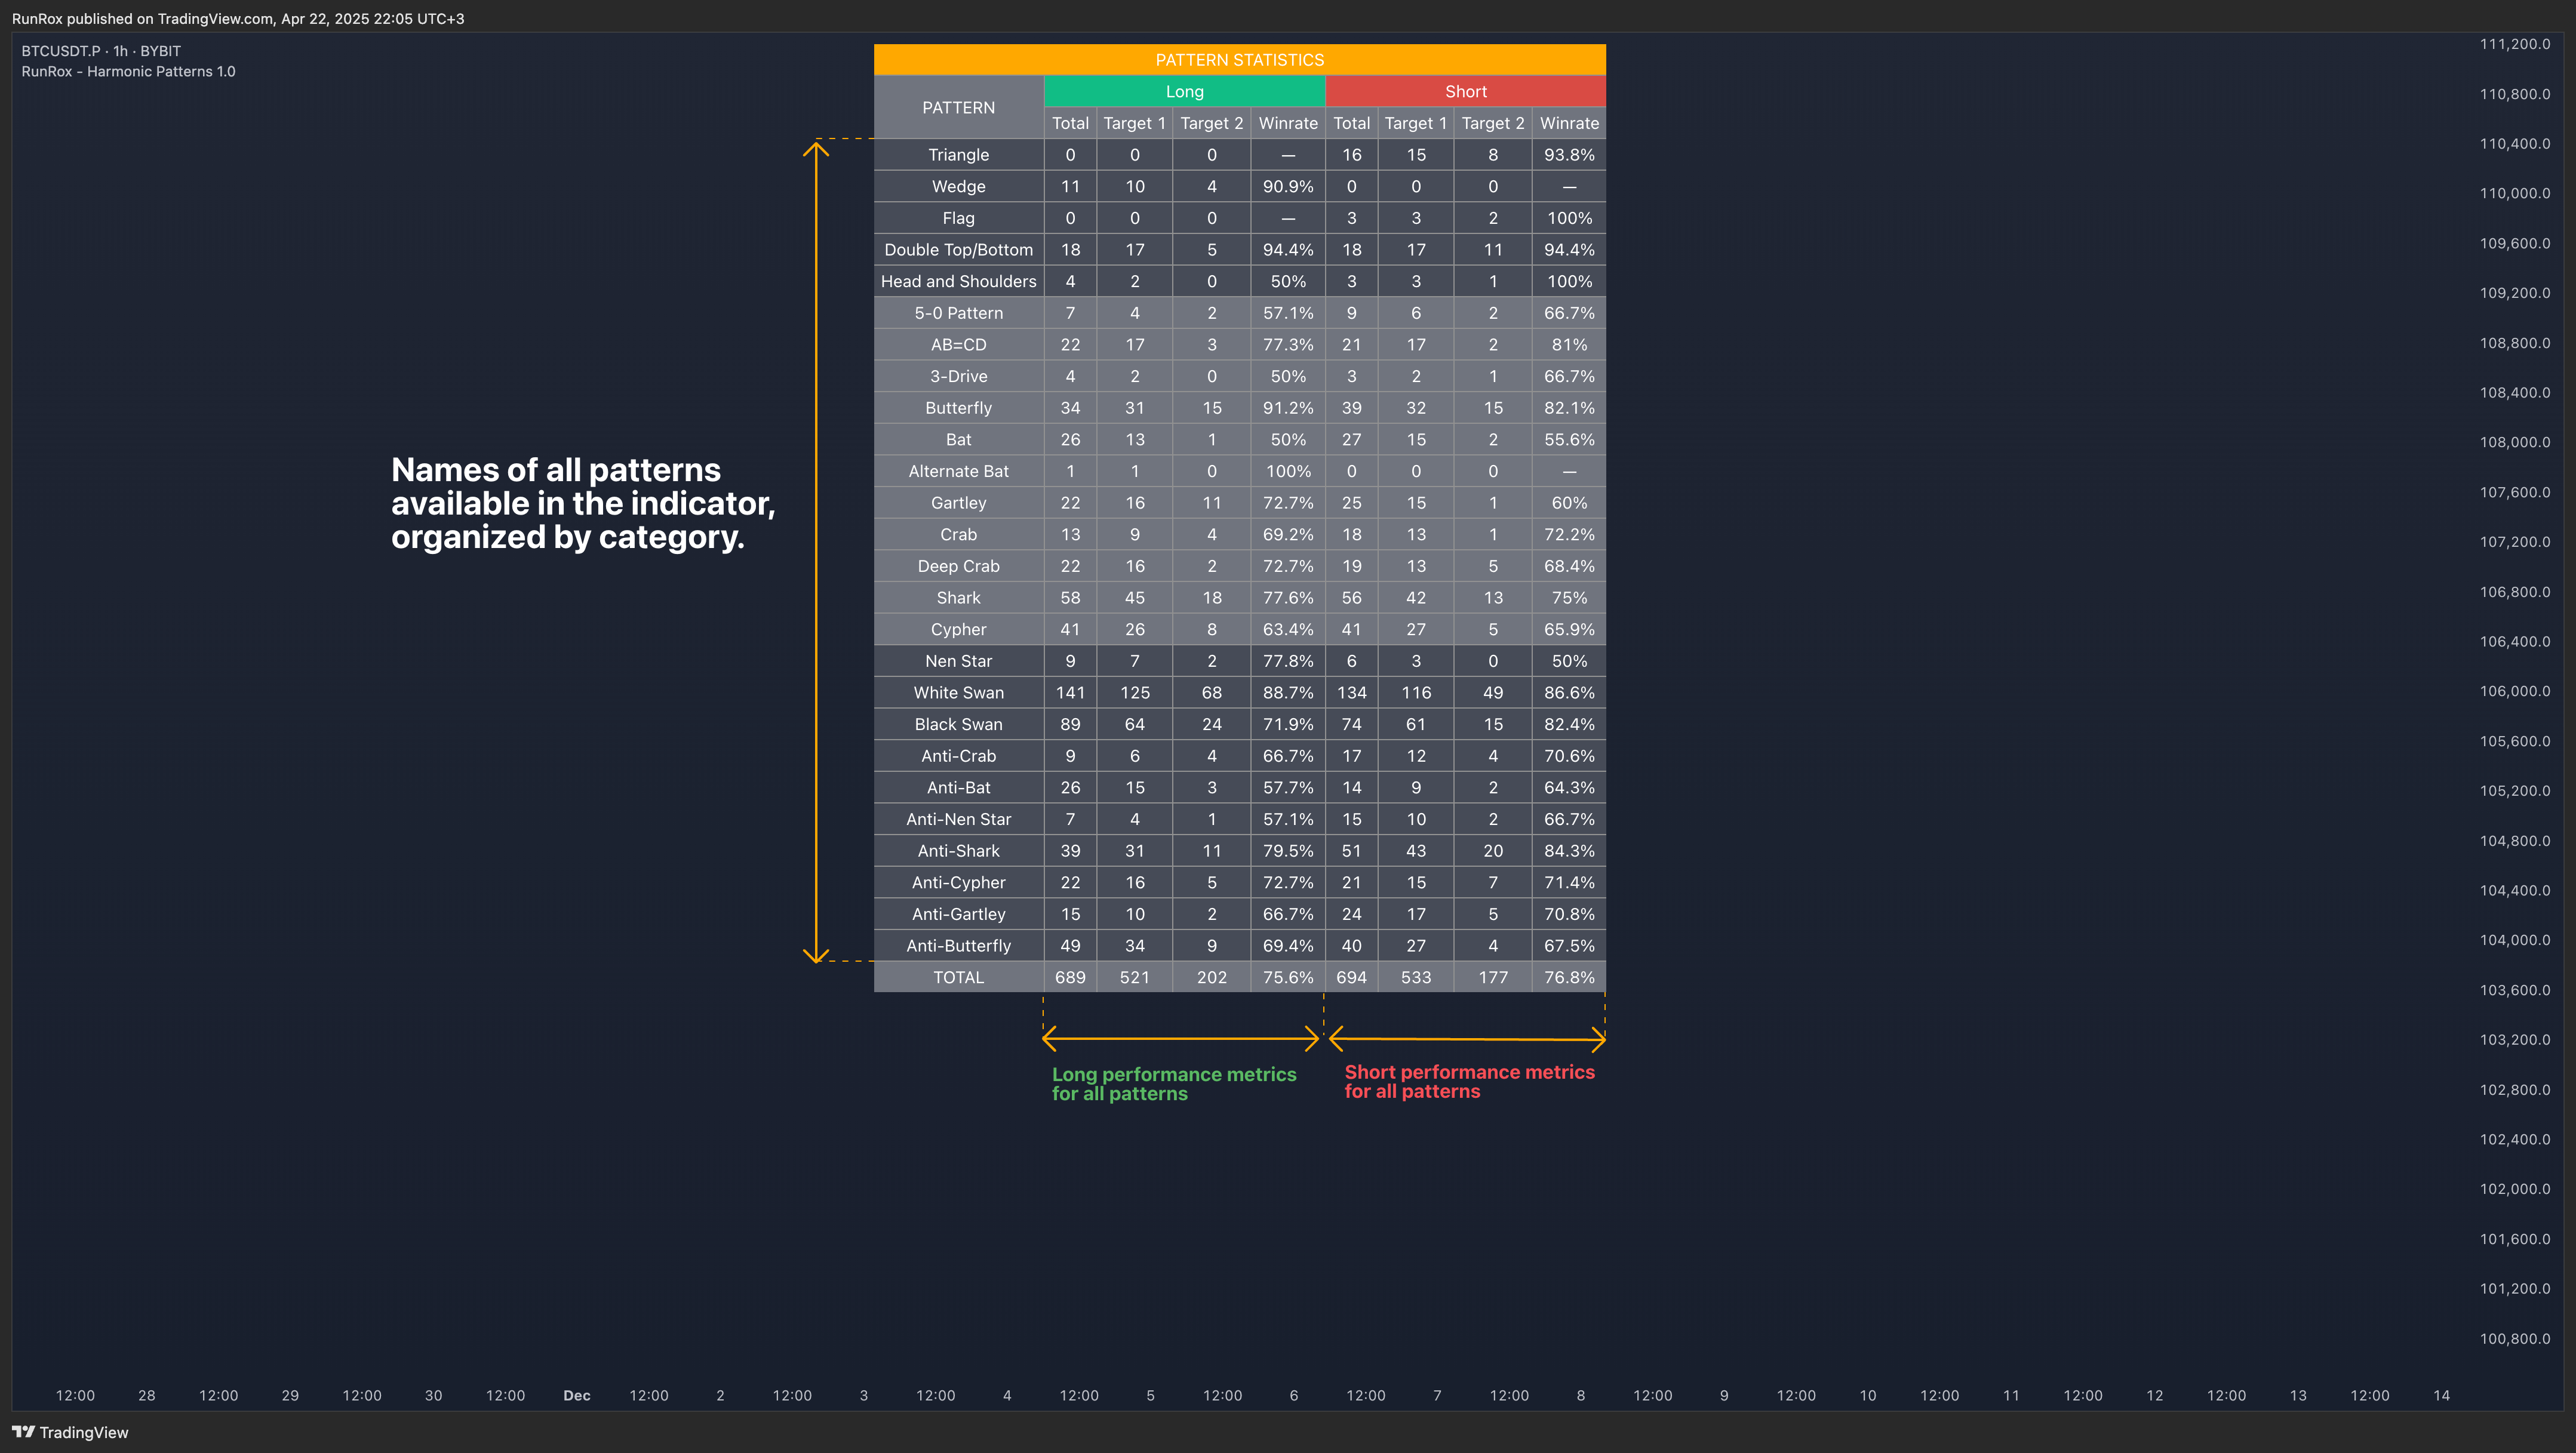
This feature is highly practical as it allows you to quickly evaluate the effectiveness of each pattern directly on your chart. As a result, you can easily identify which patterns are performing best and which patterns might be less effective and therefore unsuitable for trading on the current instrument.

Furthermore, the panel organizes patterns into specific categories Classical, Harmonic, and Anti-Harmonic and separates results by trade direction (Long or Short). This helps you quickly determine the optimal trading direction for each pattern category.